
 In a strong, equitable economy where gains are widely shared, workers of all backgrounds have good paying, high quality jobs that enable them to pay the rent, put food on the table, care for their loved ones, and pursue their dreams. In turn, these workers are healthy and productive and their contributions to economic activity are maximized. Economists often look at overall measures such as gross domestic product or unemployment to determine the health of the economy, but these measures fail to tell the most important part of the story—the part about the people whose wellbeing and access to opportunity and mobility undergirds the strength of the economy. By broad measures, the District’s economy has often looked strong, but those gauges miss massive differences in wellbeing by race and ethnicity that are chronic.
While some residents have high-paying, high-powered jobs and extreme wealth, many other residents struggle to find employment or earn enough to afford DC’s high cost of living. And, in a jurisdiction that is majority people of color, Black and Latino residents have worse economic outcomes than white residents by every measure, such as unemployment, underemployment, and median wages—both during good and bad economic times. This reality is rooted in a long history of racism in policies and systems that denied Black and later non-Black people of color in DC equal access to quality education, jobs, and wealth-building opportunities.
Although the disparities in DC’s economy are long-standing, economic conditions have become even tougher for Black and Latino DC residents in the past decade with lingering effects from the Great Recession, the economic shock of the COVID-19 pandemic, and the District’s high cost of living, especially for housing, that is making DC a more unaffordable place to live for those who aren’t wealthy. Now President Trump has slashed the federal workforce—a longtime bright spot for Black workers—and the safety net, and he has sent federal agents to patrol District streets. These conditions are making it even harder for Black and Latino residents to go about their daily lives and earn a living.
To better understand the comprehensive set of factors affecting worker wellbeing and the strength of DC’s economy, and to inform relevant policy solutions, this report examines both long-term and recent economic data about the District and its residents by race and ethnicity. The picture these data paint is one of deeply divided economic experiences and prospects of District residents in employment, wages, occupations, affordability, and more, based on their racial and ethnic background. DC policymakers must take strong actions—including those laid out in the final section of this report—to meet this challenging moment for Black and Latino workers and redress chronic racial disparities to make the District’s economy one in which all residents can thrive.
Key Findings
- Black and Latino DC residents have worse outcomes by every employment measure, such as wages, unemployment, and underemployment due to systemic racism.
- Black DC residents face barriers to participating in the workforce, such as unequal access to education, employment discrimination, and mass incarceration, and, as a result, only 59 percent of Black working-age residents were in the labor force in 2024, compared to 82 percent of white residents.
- White DC workers’ median hourly wage in 2024 was about 1.8 times that of Black and Latino workers.
- Black DC workers are disproportionately clustered in lower wage jobs. Six of the ten most common occupations for Black DC workers from 2020 to 2024 paid a median hourly wage at or below $29 per hour, while the lowest paid of the ten most common occupations for white DC workers paid a median hourly wage of $44.
- DC has among the highest racial unemployment disparities in the US, with average unemployment rates in the third quarter of 2025 of 9.9 percent for Black residents, 7.5 percent for Latino residents, and only 3.6 percent for white residents.
- Concentration in lower wage jobs combined with a high cost of living means that many Black and Latino DC residents struggle with everyday expenses.
- Wages rose in 2020 for lower wage earners potentially driven by COVID-related labor shortages and upward pressure from a $1 rise in the DC minimum wage in July 2020. However, these higher wages were never enough to cover the cost of living in DC, and the increases have not been sustained.
- A family of three in DC with one adult and two children would need an annual income of $144,999 to have an adequate standard of living—nearly two and a half times higher than the Black median household income of $60,591 in 2024.
- 54 percent of Black DC renters paid more than 30 percent of their income (i.e., the standard of affordability) towards rent on average from 2019 to 2023.
- By slashing the federal workforce and gutting the safety net, President Trump and his allies in Congress will exacerbate existing racial disparities in the District.
- Mass reductions to the federal workforce are likely to hit Black residents particularly hard, since nearly 29 percent of DC’s federal workforce was Black as of September 2024, and Black workers disproportionately work in agencies with the steepest cuts.
- The federal cuts are likely to send DC into a mild recession just as both the federal and DC governments are cutting critical safety net programs that help residents—especially Black and Latino families—weather financial crises, such as the Supplemental Nutrition Assistance Program, Medicaid, Temporary Assistance for Needy Families, and the DC Health Care Alliance.
- Black and Latino residents experience disproportionate harm from recessions, with much higher unemployment spikes than white workers, periods of unemployment that last longer, and more difficulty finding full-time employment after downturns.
- DC lawmakers must better support workers with policies that both mitigate harm from the economic downturn and address chronic racial disparities.
High Economic Inequality is a Drag on DC’s Economy
High inequality is not only a matter of unfairness. It hampers economic growth and mobility, and as some research indicates, can destabilize democracies as the wealthy amass undue power over policy decisions. This means that the highly uneven distribution of income and wealth in DC is a drag on the economy, at the least, and potentially impedes the ability of workers and residents with low and middle incomes to shape their future.[1,][2]
Several indicators show that the District of Columbia is highly unequal. The Gini coefficient for DC—which is a measure of income inequality where zero means perfect equality (everyone has the same) and one means total inequality (one person has everything)—was .52 in 2024. This figure is statistically tied with Puerto Rico and New York for the highest in the nation.[3] The top fifth of earners in the District receive nearly 55 percent of aggregate household income, while the lowest fifth of earners receive less than 2 percent of aggregate income (Figure 1).[4] In fact, the top 5 percent of earners in DC receive a larger share of aggregate income than the bottom 60 percent of earners combined.[5]
Figure 1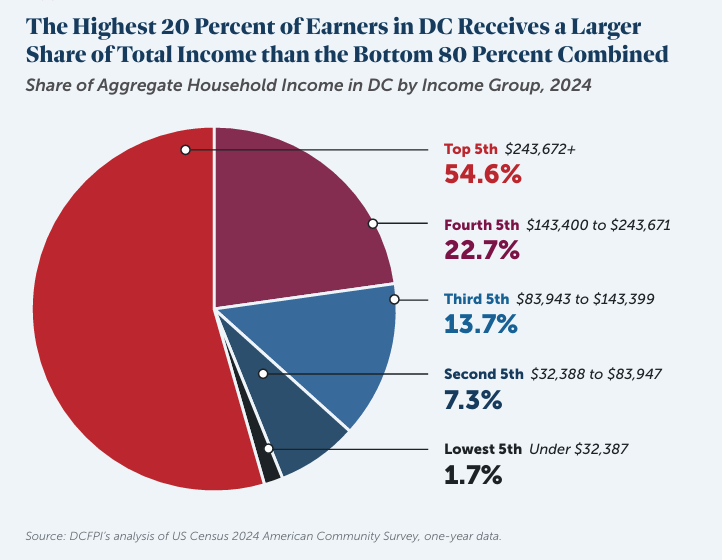
Income inequality in DC has increased over the past four decades, with disparities in wages between the high and low ends of the wage distribution in DC much greater now than in the early 1980s. The 90th percentile of the wage distribution in 2024 was 5.6 times higher than the 10th percentile, compared to 4.1 times higher in 1980.[6] And looking at wages alone does not tell the whole story of inequality, because higher income workers also tend to also receive more forms of non-wage compensation from their employers, like health insurance, life insurance, and retirement plans.[7] Much of the economic inequality in DC is driven by racial disparities.
Systemic Racism and Displacement Have Shifted the Demographics of DC’s Workforce
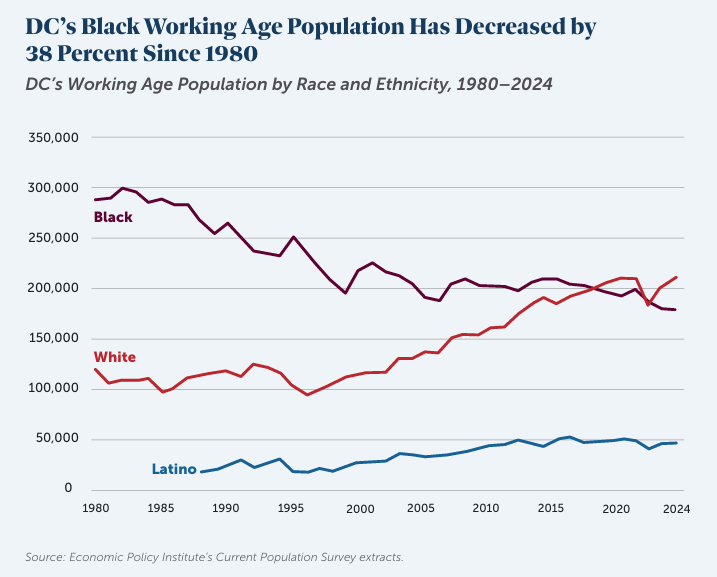
The demographics of the District’s working age population have changed drastically over the past several decades, reflecting broader changes in DC’s population. The District’s Black population has been declining since the 1970s and today, Black residents make up a plurality rather than the majority of DC residents. The exodus of Black residents stems from years of disinvestment in Black neighborhoods, discrimination, and displacement driven by out-of-reach housing costs and wages that have not matched the District’s high cost of living.[8]
This population shift is evident in the massive decrease in the District’s Black working age population, which fell by 38 percent from 1980 to 2024 (from 289,000 to 179,000 people), while the white working age population grew by 77 percent in the same period (from 119,000 to 211,000 people), as shown in Figure 2.[9] During the same time period, the District’s Latino population has grown significantly, becoming an increasingly important part of DC’s workforce. The number of working age Latino residents in DC more than doubled from 20,000 in 1989 to nearly 47,000 in 2024.[10]
Figure 2
Black Workers in DC Face Barriers to Participation in the Labor Force
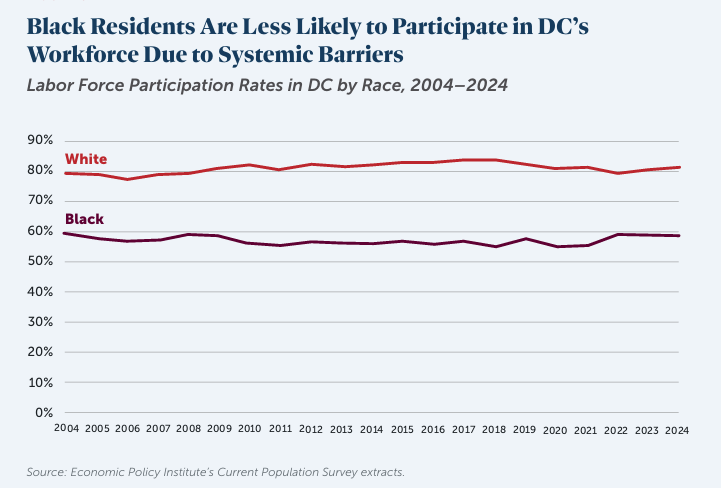
The District’s labor force participation rate, which measures the proportion of people working or actively looking for work relative to the total working age population, was 72.4 percent as of 2024 compared to the national rate of 62.6 percent.[11] This high overall rate masks ingrained structural inequities that often prevent Black residents from seeking employment. Because of systemic racism, Black residents have unequal access to education, especially postsecondary education, and they also face employment discrimination—both of which create barriers to participating in the labor force. The mass incarceration of Black men, driven by systemic racism, also negatively affects labor force participation, since those with criminal records have limited job prospects, which may deter them from seeking employment.[12]
In 2024, only 59 percent of Black residents were in the labor force, compared to nearly 82 percent of white residents.[13] The chronic gap between Black and white labor force participation has existed since the 1980s, and since 2004 that gap has not fallen below 20 percentage points (Figure 3).
Figure 3
Black and Latino DC Workers Face Occupational Segregation, Lower Wages, and Higher Unemployment
The District’s long history of exploitation of Black workers and exclusion of Black workers from many New Deal worker protections contribute to many of the current employment disparities between Black and white workers, as discussed in the breakout box.[14] The result today is that Black and Latino workers in DC have relatively poor employment outcomes compared with white residents—including chronically lower wages, occupational clustering in lower paying positions, and higher unemployment.
Structural racism creates disparities in educational completion, which impact employment. While nearly 93 percent of white residents have a bachelor’s degree or higher, only 36 percent of Black residents and 59 percent of Latino residents have a bachelor’s degree or higher, putting them at a disadvantage in the labor market.[15] Educational differences alone, however, do not fully explain racial differences in employment outcomes. National studies that account for differences in education, experience, and region, find that there still exists a significant pay gap between Black and white workers, which points to racial discrimination as a factor.[16] Racism also causes the over-policing and disproportionate incarceration of Black residents, which undermines their ability to find and maintain employment.[17],[18]
Black Workers Have been Exploited Throughout DC’s History
The exploitation of Black people’s labor in DC goes back to the District’s founding when enslaved Black people cleared much of the land for the federal city and made up about half of the workers who built the White House and Capitol.[19] In the 1830s, Black Codes restricted which occupations free Black people could engage in, largely limiting them to unskilled labor, domestic service, and hotel work.[20] Limited employment opportunities and low wages persisted for Black DC residents after emancipation. Some white employers, particularly in hospitality, implemented tipped wages to avoid paying Black workers a fair wage.[21] In the 1930s, New Deal worker protections excluded workers in what at the time were predominantly Black occupations, such as domestic service, from benefitting.[22]
Many Black people moved to DC for better work opportunities in the 1940s as part of the Great Migration, but Black federal workers also faced discrimination, with more than 60 percent holding custodial jobs and only 2 percent holding higher-level positions.[23] White policymakers and private actors also systematically denied Black people opportunities to build wealth through practices such as redlining and forced removal from their homes through urban renewal projects, such as in Southwest DC in the 1950s.[22],[23]
This historic systemic racism persists in the disparities we see today in DC, with economic disadvantages transmitted from one generation to the next. Children who grow up in households with low incomes—which is the case for many Black children in DC—have low intergenerational economic mobility rates, meaning they are likely to have low incomes as adults.[24] Because most wealth is inherited, the historic denial of wealth building opportunities means that white households in the DC area today have 81 times more wealth than Black households.[25]
See DCFPI’s report Black Workers Matter for a more extensive history of the exploitation of Black workers.
Black and Latino Workers’ Median Wages are Nearly Half that of White Workers
Black and Latino workers in the District of Columbia have consistently lower wages than white workers. The median hourly wage for Black DC workers in 2024 was $29.61 and $28.79 for Latino DC workers—meaning that half of Black and Latino workers earned less than around $29 per hour. White DC workers received a median hourly wage of $52.69—about 1.8 times higher than that of Black and Latino workers.[28] This large gap is chronic, as shown in Figure 4.[29] In addition, racial wage disparities persist across the wage distribution. In 2024, the bottom wage percentile for white workers was $24.71 per hour, which was nearly the same as Black workers at the 40th percentile ($24.65).[30]
Figure 4
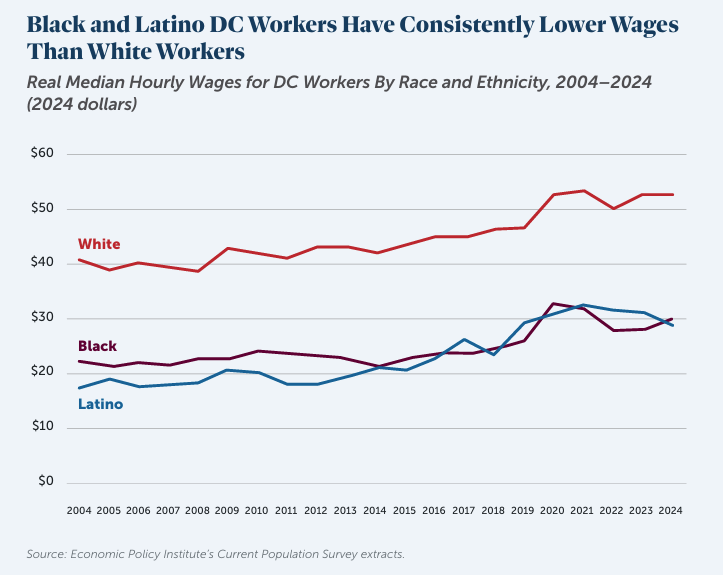
Black workers are also more likely to be working multiple jobs, with 8 percent of Black workers having multiple jobs in 2024 compared to 5.3 percent of white workers.[31] This suggests that some Black workers cobble together multiple jobs with lower wages to make ends meet.
Black DC Workers are More Concentrated in Lower Wage Occupations
For Black workers in the District, lower wages is the result of being concentrated in lower paying jobs, as shown in Table 1.[32] For example, the second and fourth most common occupations for Black workers from 2020 to 2024 were security guards and cashiers, with median hourly wages of $17 and $15, respectively, for Black workers in those occupations.[33] Overall, six of the top ten most common occupations for Black workers in DC from 2020 to 2024 paid a median hourly wage to Black workers at or below $29 per hour. By comparison, the lowest paid among the top ten most common occupations for white DC workers—postsecondary teachers—paid a median hourly wage of $44.23 to white workers.[34]
Table 1
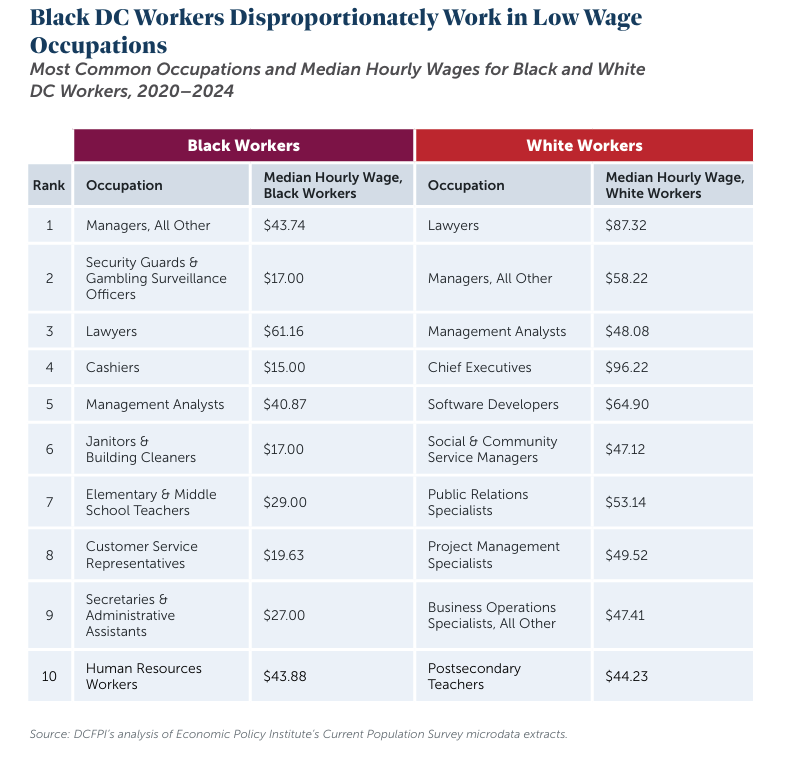
Working in a higher-paying occupation, however, does not close the pay gap for Black workers. While managers and lawyers were the first and third most common occupations for Black DC workers from 2020 to 2024, their median hourly wages of $43.74 and $61.16, respectively, were significantly lower than the median wages of white managers and lawyers at $58.22 and $87.32.[35]
Employment is More Precarious for Black and Latino Workers than White Workers
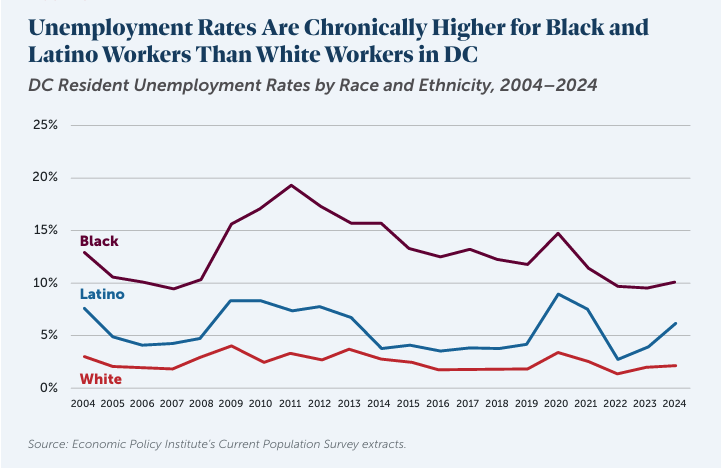
Employment is less secure for Black and Latino District workers than white workers, as demonstrated by consistently higher unemployment rates. In the third quarter of 2025, the average unemployment rate was 9.9 percent for Black residents and 7.5 percent for Latino residents, compared to 3.6 percent for white residents. In fact, DC had the second highest Black-white unemployment ratio and third highest Latino-white unemployment ratio in the nation in the third quarter of 2025.[36] These disparities are chronic. Between 2004 and 2024, average unemployment for Black workers ranged from 9.4 percent to 19.4 percent, while white unemployment was as low as 1.4 percent and never higher than 4.1 percent (Figure 5).[37] Employment is especially precarious for young Black workers as detailed in the box below.
Figure 5
Black and Latino workers also have more difficulty finding full-time employment matching their skills, as shown in the underemployment rate, which measures people working part-time who want to work full-time at a job matching their skills. In 2024, DC’s underemployment rate was 14.4 percent for Black workers and 12.1 percent for Latino workers compared to 3.7 percent for white workers.[38] The underemployment rate is part of a wider issue for Black workers of underutilization of their skills. For example, nationally Black workers with college degrees were nearly 10 percentage points more likely to be employed in an occupation that does not typically require a college degree compared to white workers in 2019.[39]
Structural Racism Hurts Young Black Workers Trying to Start Their Careers
The racial disparities in employment discussed in this report hit young Black workers particularly hard. Systemic racism causes Black youth to disproportionately face barriers to employment, such as homelessness, poverty, community-level violence, being in foster care, failing schools, and over-incarceration.[40] These barriers translate into lower labor force participation. On average from 2022 to 2024, 51 percent of Black youth aged 16 to 24 participated in the labor market compared to 62 percent of white youth. Black youth participating in the workforce also experience much higher unemployment, with an unemployment rate for Black youth of 18.4 percent on average for 2022 to 2024—five times higher than for white youth (3.7 percent).[41]
The disadvantages Black youth experience in their early careers are likely to reverberate in lower wages and poorer job quality throughout their working lives. For each week that a young person is unemployed from ages 20 to 23, their job quality at age 29 is reduced, research shows.[42]
See DCFPI’s report A Quality Job Guarantee Would Ensure DC Youth Can Fully Participate in DC’s Economy to learn more about the barriers young Black workers face.
Wages for Low- and Moderately-Paid Workers Fail to Meet the High Cost of Living in DC, Hitting Black and Latino Residents the Hardest
Concentration in lower wage jobs and greater employment precarity mean that many Black and Latino residents struggle with everyday expenses. On one side, Black and Latino residents contend with the District’s high cost of living, especially for housing. And on the other side, they are faced with the fact that wages at the lower end of the income distribution are inadequate to meet those high costs despite some COVID-era wage gains and annual increases to DC’s minimum wage.
The District is One of the Most Expensive Places to Live in the Country
The District has some of the highest costs for housing, food, and child care in the nation. A family of three with one adult and two children would need an annual income of $144,999 to have an adequate standard of living in DC, which is higher than overall median income ($112,124) and nearly two and a half times higher than the Black median household income of $60,591 in 2024, adjusted for 2025 dollars.[43],[44]
Housing is considered unaffordable when rent exceeds 30 percent of one’s income. Fair market rent for a one-bedroom apartment in DC in 2025 was $2,056 per month. By definition, an individual working a minimum wage job in the District would need to work 90 hours a week for this level of rent to be affordable.[45]High rents particularly hurt Black residents in DC, with 54 percent of Black renters paying more than 30 percent of their income towards rent on average from 2019 to 2023.[46] Compounding high rents, District residents are experiencing increasingly high electricity costs, with average residential rates increasing 34 percent from September 2024 to September 2025 after adjusting for inflation.[47]
District residents also foot the highest monthly grocery bills in the country, paying, on average, over $1,300 a month in food costs, nearly $300 dollars more than the national average.[48] Because of persistent racial disparities in employment and wages, food is particularly unaffordable for many Black residents, who made up nearly 84 percent of DC households receiving Supplemental Nutrition Assistance Program (SNAP) in 2024.[49] SNAP benefits do not fully meet the needs of DC residents facing high food costs as shown by the 8.8 percent of DC residents who were food insecure, on average, between 2021 and 2023, meaning that they didn’t have enough nutritious food to eat on a regular basis, due to limited funds and access to food.[50]
Parents of young children face the highest child care costs in the country. Residents with two young children pay an average of just over $47,000 a year for child care, compared to just over $29,000 on average nationally.[51] For DC residents with low incomes—who are disproportionately Black and Latino—child care can cost up to 32 percent of their annual pay.[52]
DC invests in making the cost of living more affordable for residents with low incomes, such as by providing housing vouchers to subsidize rent, subsidizing the cost of child care for some residents with low incomes, and topping up SNAP benefits for residents receiving monthly benefits below $30. However, not everyone who needs these benefits is able to receive them because of eligibility restrictions or inadequate funding, and even for those who do receive them, the benefit amounts are sometimes insufficient to meet their needs fully.
Pandemic Era Wage Gains Have Not Been Sustained
High prices are just one side of the equation. These prices are unaffordable to many DC residents because wages for low- and moderate-income workers are much lower than the total cost of necessities. And since they are disproportionately represented in low-wage jobs, Black and Latino workers have borne the brunt of the failure of lower wage jobs to meet the District’s high costs.
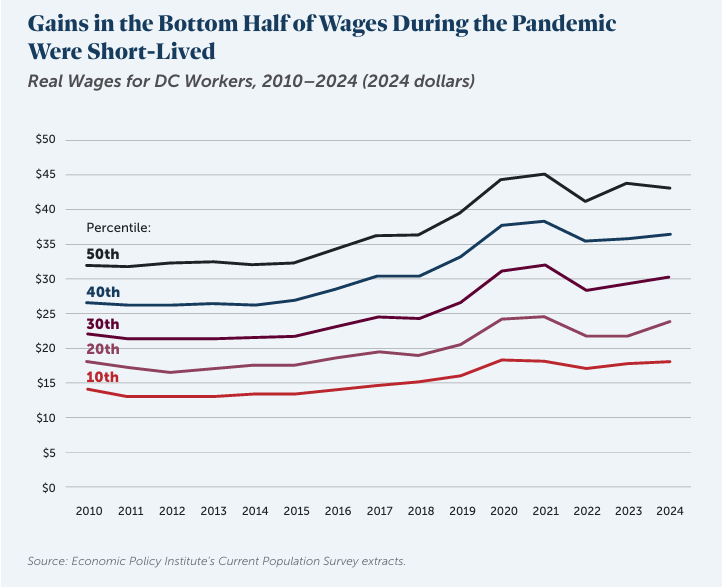
Although low- and moderate-wage workers saw growth in their wages during the COVID-19 pandemic, that growth was small, especially at the bottom of the wage distribution, and short-lived. The bottom percentile of worker wages in DC saw a $2 real increase in hourly wage growth from 2019 to 2020 (from $15.76 to $17.82 in 2024 inflation-adjusted dollars), potentially driven by COVID-related labor shortages and upward pressure from a $1 rise in the DC minimum wage in July 2020 (Figure 6). This increase at the 10th percentile of the wage distribution was less than half the increase at the 50th percentile, which rose by $4.66 per hour and at the 30th percentile, which rose by $4.31 per hour from 2019 to 2020, in inflation-adjusted 2024 dollars.[53] All gains across the bottom half of the wage distribution, however, disappeared by 2022, as wages failed to keep up with high inflation. As of 2024, real wages still had not risen back to the 2020 peak.[54]
Figure 6
An important consideration in looking at changes in wages at the 10th percentile is that the increases may be largely driven by increases in DC’s minimum wage. Since 2021, DC’s minimum wage has increased annually in proportion to increases in the Consumer Price Index, a tool for measuring inflation. In July 2024, DC’s minimum wage increased from 17.00 to $17.50 an hour. The wage for the bottom percentile of earners in 2024 was $17.54, which indicates the importance of policy-driven wage increases for low-wage workers.[55]
At the same time, DC maintains the racist legacy of a lower base minimum wage for tipped workers of $10 per hour, despite two separate ballot referendums in which DC voters elected to eliminate the tipped minimum wage. Having a separate tipped minimum wage exacerbates racial and gender inequities. The majority of tipped workers in DC are women, and 62 percent of the tipped workforce are Black or Latino. Tipped workers experience a poverty rate that is nearly three times more than among non-tipped workers.[56] Relying on tipping also makes workers vulnerable to wage theft and sexual harassment.[57]
Hostile Federal Actions Exacerbate Existing Racial and Ethnic Inequities
On top of racial economic disparities and an unaffordable cost of living, District Black and Latino residents have had to contend with several blows to DC’s economy and resident safety and wellbeing over the past year perpetrated by President Trump. Trump and his allies in Congress have drastically decreased the federal workforce, implemented a harsh and often violent immigration crackdown, deployed federal agents and National Guard troops to DC’s streets, and made deep cuts to the safety net.
Federal Workforce Cuts Are Likely to Exacerbate the Black-White Employment Gap
Almost immediately after coming into office, President Trump began dramatically slashing the federal workforce through firing probationary workers, reductions in force, and deferred resignation offers.[58] Overall, the DC region lost around 72,000 federal jobs in 2025, with about 24,000 of those reductions in DC.[59] While federal employees work throughout the country, the federal government and affiliated industries are the backbone of DC’s economy. Data from early 2025 showed just over 49,000 federal workers lived in DC, making up about 13 percent of total resident employment.[60] Many DC residents also work for federal contractors and nonprofit organizations, some of which the Trump administration has cut funding for, resulting in layoffs.[61]
The reduction of the federal workforce is likely hitting Black residents particularly hard. As of September 2024, nearly 29 percent of DC’s federal workforce was Black.[62] Although DC-resident specific data is not available, national data show that many of the agencies targeted for large layoffs had high shares of Black federal workers, such as the Department of Education (36 percent) and Department of Housing and Urban Development (36 percent).[63] These cuts are also likely disproportionately hurting Black women, since Black women’s share of the federal workforce nationally was nearly double that of their share in the overall workforce as of 2023. Although this data is not available for DC, it is likely that Black women make up a large share of the federal workforce in the District.[64]
Federal employment has been a longstanding pathway to the middle class for Black households, particularly in DC, because federal work has provided more fairness and better employment opportunities for Black workers than many other industries. As of September 2024, 92 percent of Black federal workers worked full-time year-round compared to 73 percent of Black workers in all industries.[65] While across all industries, Black workers were paid 75 cents for every dollar paid to non-Latino white workers, the gap for Black federal workers was narrower at 87 cents. Federal workers are also more likely to have retirement, health insurance, and paid parental leave benefits than employees in the private sector.[66] Now, with the cuts to federal jobs, especially in agencies with a disproportionate share of Black workers, this longstanding pathway to the middle class is at risk.

The Immigration Crackdown and Federal Takeover Have Hurt DC’s Economy
In August 2025, under the auspices of a crime emergency, Trump took control of the District’s Metropolitan Police Department (MPD), unleashed a surge of federal agents, including Immigrations and Customs Enforcement (ICE), and deployed the National Guard from DC and several Republican-led states. Immigrants, young Black men, and unhoused people have been and continue to be targeted by these forces, especially ICE.
Although it is difficult to pinpoint the exact economic impact of these actions, initial data indicates potential harm to DC’s economy. Pass_by, which uses data from several sources to calculate foot traffic, estimated that foot traffic in DC dropped 6 percent the week of August 11th and 5 percent the week of August 18th after the emergency declaration compared to similar weeks in 2024.[67] DC sales tax collections for restaurants, retail sales, and hotels were down in August from the previous August.[68] In September, resident and visitor spending at brick-and-mortar locations in DC decreased compared to September 2024, and hotel revenue per available room declined almost 16 percent from the prior September.[69] More data will be needed to see if these trends persist, but the initial signs point to a negative impact from Trump’s actions.
Immigrants are an essential part of DC’s economy (see breakout box). While it is difficult to obtain data on the economic impact of the immigration crackdown, anecdotal information provides a window into the harm to DC’s immigrant workforce and the industries that depend on them, especially restaurants. In September, The Washington Post spoke with restaurant owners who shared how workers in their industry were being targeted and how challenging that makes it to run their restaurants.[70] Interviews with restaurant owners by WUSA9 news found that several restaurants closed over Labor Day weekend, because workers were afraid to come to work.[71] This anecdotal information is in line with past research showing that during periods of increased immigration enforcement, even immigrants not targeted for deportation were concerned about leaving their homes and participating in everyday activities.[72]
Immigrants are a Vital Part of DC’s Workforce
DC is home to more than 95,000 immigrants, or 14 percent of the population, and in 2023, nearly 47,000 people were non-citizens, including both documented and undocumented migrants. Immigrants are vital to DC’s workforce.[73] In 2023, 16 percent of DC workers were immigrants, making up a substantial percentage of the workforce in several key occupations, including:
- 58 percent of dishwashers
- 56 percent of landscaping workers
- 52 percent of maids and housekeepers
- 49 percent of child care workers
- 27 percent of registers nurses
- 27 percent of cooks
- 19 percent of physicians[74]
The Trump administration’s blatantly racist attacks on DC’s immigrant population threatens key industries—like child care, healthcare, hotels, and restaurants—that help power the District’s economy. If a large number of immigrant workers were to be deported, it is unlikely that US-born workers could replace them all, especially in hospitality and child care. This would destabilize the workforce in those industries and leave businesses scrambling to find workers.
For more on this topic, see DCFPI’s brief The Devastating Economic and Human Toll of Mass Deportation: What’s at Risk in DC.
DC is Headed Into a Recession Just as Benefit Cuts Go into Effect
All the harmful actions by the Trump administration have broad repercussions for DC’s economy. DC’s overall unemployment rate increased 1.4 percentage points from 5.3 percent in December 2024 to 6.7 percent in December 2025.[75] DC’s Chief Financial Officer (CFO) projected a $669 million decrease in DC’s revenue over the next three years in his September 2025 revenue estimate compared to previous estimates largely due to the federal cuts, and he predicted that DC would enter a moderate recession in 2026.[76]
Economic downturns fall hardest on Black and Latino residents, and the harmful effects of this downturn will be compounded by the fact that both the federal and DC governments are cutting critical safety net programs that help households weather financial crises. The Republican megabill passed in July of 2025 imposes harsh new work requirements for Medicaid and Supplemental Nutrition Assistance Program (SNAP) recipients, putting up to 114,000 residents at risk of losing Medicaid and up to 14,000 residents at risk of losing some of their SNAP benefits.[77]
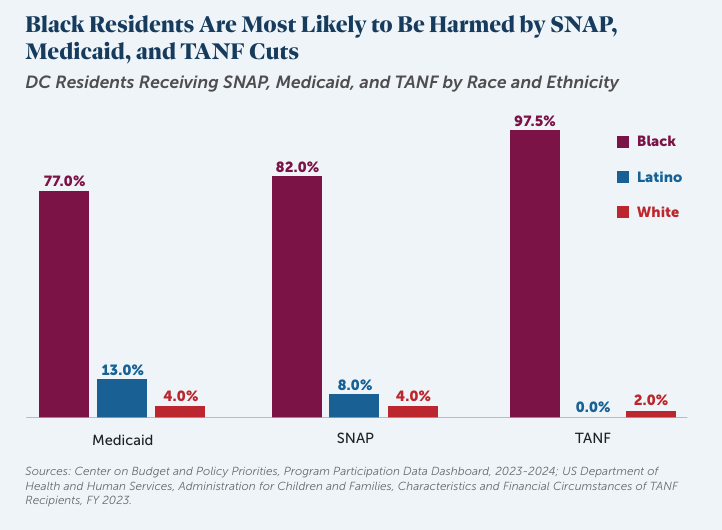
At the local level, Mayor Bowser and the DC Council cut or failed to adequately fund several safety net programs in the fiscal year (FY) 2026 budget and four-year financial plan. The budget severely narrowed eligibility and benefits for the Health Care Alliance, which serves people with low incomes ineligible for Medicaid, largely immigrants.[78] The mayor and Council also did not fund any new Permanent Supportive Housing vouchers for individuals who are unhoused, and funding for the Emergency Rental Assistance Program (ERAP) is far below need. Without any changes to the financial plan, 14,000 families will have their Temporary Assistance to Needy Families (TANF) benefits severely reduced in FY 2027. The local and federal cuts to benefits will fall hardest on Black and Latino residents who make up most participants in SNAP, Medicaid, and TANF in DC, as shown in Figure 7.
Figure 7
Recessions Cause Worse and Longer Lasting Harm to Black and Latino Residents
With DC facing another potential recession, the most recent downturns—the Great Recession and the COVID-19 recession—provide insights into the effects on residents. While downturns cause some pain across the board, Black and Latino residents experience disproportionate harm, with much higher unemployment spikes than white workers, periods of unemployment that last longer, and more difficulty finding full-time employment matching their skills after downturns.
Unemployment Spikes More for Black and Latino Residents in Economic Downturns than White Residents
The disparities in the unemployment rate between Black and Latino residents persist in both periods of economic growth and recession. In fact, the unemployment rates for Black and Latino residents during times of economic growth are higher than the rate experienced by white residents during periods of recessions. And when economic downturns do hit, spikes in unemployment are more extreme and recovery is slower for Black and Latino workers, such as in the Great Recession, which lasted from the fourth quarter of 2007 through the second quarter of 2009. The unemployment rate for Black DC residents peaked two years after the end of the recession in 2011 at 19.4 percent, and the unemployment rate for Latino DC residents peaked at 8.4 percent in 2009. Meanwhile, the unemployment rate for white DC residents only reached as high as 4.1 percent in 2009. During the shorter COVID-19 recession in 2020, Black unemployment increased to 14.7 percent in 2020 (from 11.8 percent in 2019), and Latino unemployment jumped to 9.0 percent (from 4.2 percent in 2019), while white unemployment increased only to 3.5 percent (from 1.9 percent in 2019).[79]
White residents’ employment also recovered more quickly from the Great Recession than Black residents. By 2010, white residents had an average unemployment rate of 2.4 percent, and although the rate fluctuated between 2011 to 2015, it stayed under around 4 percent. Beginning in 2016, the rate for white residents dropped below 2 percent and stayed there until the COVID downturn. For Black residents, recovery was slow and ultimately incomplete. After peaking in 2011, the unemployment rate for Black residents dropped each year from 2012 through 2016 but the rates were still higher than in 2006 prior to the recession. In fact, the unemployment rate for Black residents never reached the 2006 rate before the COVID downturn hit. Employment recovery for Latino residents was faster than for Black residents—reaching below the 2006 unemployment rate by 2014—but their unemployment rate still exceeded white residents through the recovery period.[80]
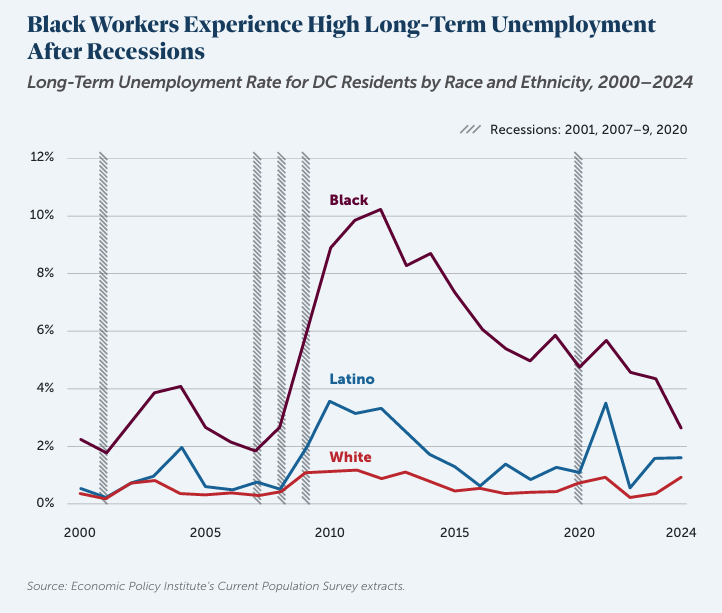
Black Workers Face Longer Periods of Unemployment After Recessions than White Workers
The racially disparate impact of economic downturns is also evident in the length of unemployment for Black workers versus white workers. The long-term unemployment rate for Black workers—which measures unemployment lasting at least 27 consecutive weeks—reached a high of 10.2 percent in 2012 and has never recovered to the 2006 rate (2.2 percent) since the Great Recession. By contrast, the long-term unemployment rate for white workers never went higher than 1.1 percent (which it hit from 2009 to 2011) and decreased to the pre-recession level by 2017, as shown in Figure 8.[81] The harm from long-term unemployment goes beyond the period of joblessness. People who are unemployed long term tend to have lower incomes once they find a job, and long-term unemployment is associated with worse mental and physical health.[82]
The high rates of unemployment and long-term unemployment that persists for Black residents for years after recession likely discourages some Black workers from participating in the labor force at all. While the gap in labor force participation between Black and white residents is chronic, as discussed in a previous section, the disparity was widest in the years following the Great Recession. It peaked in 2018, when Black labor force participation was only 55.5 percent compared to 84 percent for white residents—a 28.5 percentage point difference.[83]
Figure 8
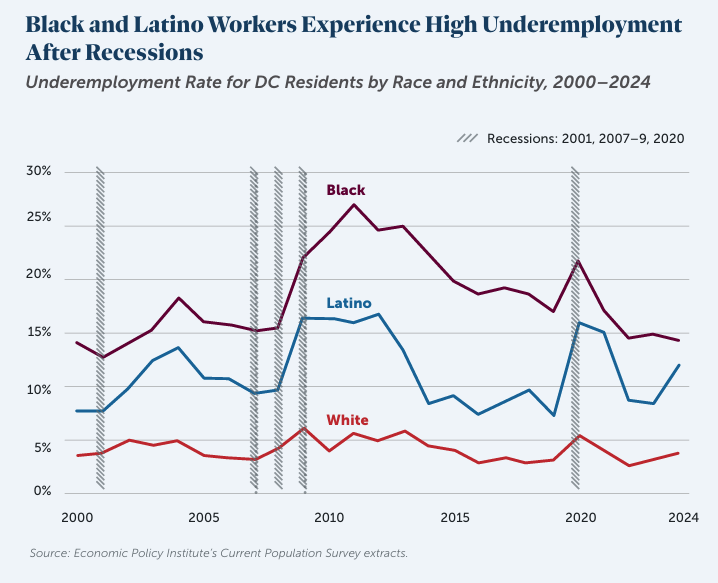
Black and Latino Workers Have More Difficulty Finding Full-Time Work After Downturns
When they find employment after downturns, Black and Latino workers are more likely to be underemployed, meaning that they are working part-time when they want to work full-time at a job matching their skills. Even during periods of economic growth, significantly more Black and Latino workers are underemployed than white workers, and these gaps become more extreme during and following economic downturns, as shown in Figure 9. For example, two years after the end of the Great Recession in 2011, 26.9 percent of Black workers and 16.1 percent of Latino workers were underemployed compared to 5.6 percent of white workers.[84]
Figure 9
DC Policymakers Must Better Support Workers with Policies that Address Chronic Racial Disparities
The data throughout this report show that the District of Columbia’s labor market is highly stratified by race and that the disparities are chronic, persisting through both periods of overall economic growth and recessions. Addressing centuries of harms from systemic racism is not a simple or easy process, but lawmakers can take concrete action to both mitigate harm from the current economic downturn and begin to address chronic disparities.
Expand Policies that Boost Workers’ Incomes and Increase Career Opportunities
Eliminate the Tipped Minimum Wage (Again). DC took a positive step toward eliminating the racist legacy of a separate tipped minimum wage in 2022 when voters approved Initiative 82, which was supposed to gradually bring the tipped minimum wage up to the regular minimum wage. However, in the FY 2026 budget, the Council overturned the will of the voters and enacted a revised plan that gradually raises the tipped minimum wage up to only 75 percent of the full minimum wage. The Council should reverse this harmful decision and raise the tipped minimum wage up to the full minimum wage, ideally by 2027 as originally planned.
Create a Youth Jobs Guarantee. To address the many structural barriers young Black and Latino workers face to gaining a foothold in the job market and obtaining quality employment, the District should create a youth jobs guarantee for 16- to 24-year-olds. A youth jobs guarantee would prioritize young people with the greatest barriers to employment, such as those experiencing homelessness, youth involved in the criminal-legal system, or youth in foster care, and place them in a high-quality, well-paid guaranteed job that aligns with their interests and career goals. The young workers would also be provided robust wraparound services and support to help them thrive.[85]
Expand Programs to Boost Residents’ Income and Economic Security. Research shows that distributing unconditional cash through guaranteed income programs improves participants’ employment choices, along with their financial wellbeing and housing quality.[86] DC has two pilot programs aimed at boosting residents’ incomes and economic security, Career MAP and Strong Families, Strong Futures (SFSF), which both provide more than $10,000 in support per year to participants.[87] DC policymakers should build on the best features of each of these pilots to raise incomes and financial security for more residents with low incomes throughout the District.[88]
 Ensure Workers Can Afford to Live in DC

Invest in Affordable Housing Development and Preservation. To make the District a place where workers can afford to live and prevent further displacement of Black residents, DC policymakers need to take additional steps to make housing more affordable. First, they should invest in the creation and preservation of affordable units by increasing the Housing Production Trust Fund and setting aside Trust Fund dollars for preservation. DC lawmakers should also invest in new approaches or scale-up existing programs that create deeply affordable housing, such as land trusts, social housing, and the Tenant Opportunity to Purchase Act. They should also fund mechanisms for moving tenants, especially long-term Black DC residents, towards individual and collective ownership, such as limited-equity cooperatives, the First Right Purchase Program and the Home Purchase Assistance Program. Lastly, lawmakers should adequately fund ERAP to prevent evictions.
Increase Child Care Affordability. Access to affordable, quality child care is essential for parents and caregivers of young children to be able to work. When parents are forced to spend more than they can afford on child care, they spend less at local businesses. When they cannot afford child care at all, they work less, which means lower incomes for families, less productivity for businesses, and less tax revenue.[89] DC policymakers can support parents and the broader DC economy by expanding the child care subsidy program to all eligible children in DC to ensure every family can afford child care. The estimated additional cost for this expansion in FY 2023 was $139 million.[90] DC lawmakers should also fully fund the Pay Equity Fund (PEF)—an innovative program that supplements the wages of early childhood educators—which would cost $94.2 million for FY 2027.[91] The PEF both provides higher wages to an underpaid workforce, mainly composed of Black and Latina women, and helps promote child care affordability and quality.
Maintain and Strengthen Income Supports that Help Residents Weather Difficult Economic Times
Mitigate the Harm from Federal Benefits Cuts. DC policymakers should direct the DC Department of Human Services (DHS) to take all possible steps to lessen the harm to SNAP and Medicaid recipients from the harsh work requirements in the Republican megabill. For example, DHS should maximize exemptions from work requirements, make reporting on work activities as easy as possible for recipients, and work with community organizations to support recipients in maintaining benefits. Although DC is likely to be exempt from new cost-sharing requirements for SNAP through FY 2026, lawmakers need to start developing a plan now for covering the cost share when those provisions kick in, so that residents’ benefits are not cut.
Reverse DC Benefits Cuts. With all the economic challenges facing DC’s most vulnerable residents, now is the time for lawmakers to shore up DC’s safety net, not cut it. They should repeal changes to TANF for FY 2027 that would eliminate cost of living adjustments and impose harsh sanctions on households reaching 60 months of receiving TANF, as well as reverse drastic cuts to eligibility for the Health Care Alliance.
Ensure Equitable Taxation and Adequate Revenue for Initiatives to Address Racial Inequities
Create a More Equitable Tax System. DC’s tax system advantages wealthy residents, who are mainly white, and profitable corporations. DC policymakers must address this racially unjust system and create a fairer tax system that brings in additional revenue to enact the type of bold ideas needed to address systemic racial economic inequality. They can achieve this by strengthening taxes on wealth, such as creating a progressively-tiered surcharge on capital gains for high-wealth households, ensuring all businesses operating in DC pay their fair share of taxes by adopting a Business Activity Tax, and making permanent the restoration and expansion of DC’s Child Tax Credit passed as part of emergency legislation in November 2025.[92]
[1] DCFPI analysis of US Census Bureau, American Community Survey, “Gini Index of Income Inequality,” 2024.
[2] US Census Bureau, American Community Survey, “Shares of Aggregate Income by Quintiles” 2024. The top fifth of earners (also known as the top quintile) refers to people who have incomes in the top 20 percent of incomes in DC, i.e., higher than 80 percent of earners. The lowest fifth of earners (also known as the bottom quintile) refers to people who have incomes in the bottom 20 percent of earners in DC, i.e., lower than 80 percent of earners.
[3] Ibid.
[4] Josh Bivens and Asha Banerjee, “Inequality’s drag on aggregate demand,” Economic Policy Institute, May 24, 2022.
[5] Erica Williams, “DC’s Extreme Wealth Concentration Exacerbates Racial Inequality, Limits Economic Opportunity,” DC Fiscal Policy Institute, October 20, 2022.
[6] The 90th percentile of the wage distribution is the wage below which 90 percent of workers fall in terms of their wages. The 10th percentile of the wage distribution is the wage below which 10 percent of workers fall in terms of their wages. DCFPI analysis of Economic Policy Institute, State of Working America Data Library, “Median real hourly wage (2024$),” 2025.
[7] The Pew Charitable Trusts, “Worker Benefits—and Their Costs— Vary Widely Across U.S. Industries,” July 2016.
[8] For more information on the historical and current factors driving displacement, see: Eliana Golding, “A Holistic and Reparative Agenda for Ending Displacement in DC,” DC Fiscal Policy Institute, November 15, 2023.
[9] DCFPI analysis of Economic Policy Institute, State of Working America Data Library, “Count of working age population,” 2025.
[10] Ibid. Note: both the Current Population Survey and American Community Survey ask respondents if they are “of Hispanic, Latino, or Spanish origin.” Throughout this paper, the authors use Latino as shorthand to encompass all responses in this category. Data is omitted throughout the paper for Asian Americans and Native Americans, because the sample sizes are too small in DC for reliable estimates for most data points.
[11] Economic Policy Institute, State of Working America Data Library, “Labor force participation rate,” 2025.
[12] Harry J. Holzer, “Why are employment rates so low among Black men?” Brookings Institution, March 1, 2021.
[13] Economic Policy Institute, State of Working America Data Library, “Labor force participation rate,” 2025.
[14] Doni Crawford and Kamolika Das, “Black Workers Matter,” DC Fiscal Policy Institute, January 28, 2020.
[15] US Census Bureau, American Community Survey, “Educational Attainment,” 2024. Note: The share of white, Black, and Latino people with a bachelor’s degree or higher in DC is much higher than nationally, across all three groups. However white residents of DC have their national counterparts beat by 52 percentage points and Latinos in DC do by about 38 percentage points. Black DC residents are just 10 percentage points above their national counterparts when it comes to attaining a bachelor’s or higher.
[16] Valerie Wilson and William Darity Jr., “Understanding black-white disparities in labor market outcomes requires models that account for persistent discrimination and unequal bargaining power,” Economic Policy Institute, March 25, 2022.
[17] Nazgol Ghandnoosh, “One in Five: Disparities in Crime and Policing,” The Sentencing Project, November 2, 2023.
[18] Diontre Davis, “Federal Efforts to Reinstate Cash Bail in DC Disproportionately Harms Black Residents,” DC Fiscal Policy Institute, September 29, 2025.
[19] Chris Myers Asch and George Derek Musgrove, Chocolate City: A History of Race and Democracy in the Nation’s Capital (The University of North Carolina Press, 2017).
[20] Kilolo Kijakazi, Rachel Marie Brooks Atkins, Mark Paul, et al, “The Color of Wealth in the Nation’s Capital,” Urban Institute, November 1, 2016.
[21] Rev. Dr. William J. Barber II, “The Racist History of Tipping,” Politico, July 17, 2019.
[22] Juan F. Perea, The Echoes of Slavery: Recognizing the Racist Origins of the Agricultural and Domestic Worker Exclusion from the National Labor Relations Act, 72 OHIO ST. L.J. I 95 (2011).
[23] Asch and Musgrove, 2017.
[24] Dedrick Asante-Muhammad, Chuck Collins, Josh Hoxie, and Emanuel Nieves, “The Road to Zero Wealth: How the Racial Wealth Divide is Hollowing Out America’s Middle Class,” Prosperity Now and Institute for Policy Studies, September 2017.
[25] Kijakazi, et al, 2016.
[26] Juan C. Palomino, Juan Gabriel Rodríguez, and Gustavo A. Marrero. “Intergenerational mobility in the US: One size doesn’t fit all,” Centre for Economic Policy Research, January 3, 2019.
[27] Kijakazi, et al, 2016.
[28] DCFPI analysis of Economic Policy Institute, State of Working America Data Library, “Median real hourly wage (2024$),” 2025.
[29] Ibid.
[30] Being in the 10th percentile means that a person’s wage is higher than 10 percent of wage earners, while being in the 40th percentile means that a person’s wage is higher than 40 percent of wage earners. Economic Policy Institute, State of Working America Data Library, “Real hourly wage (2024$),” 2025.
[31] Economic Policy Institute, State of Working America Data Library, “Multiple job holders as share of employed,” 2025.
[32] Most common job analysis is not shown for Latino workers, because the sample size is too small to be reliable.
[33] A five-year average sample from 2020-2024 was used for analyzing median wage by occupation because of small sample sizes. The minimum wage in DC went up annually in July of each year from 2020 to 2024. At the beginning of 2020, the minimum wage was $14.00, and by July 2024, the minimum wage reached $17.50.
[34] DCFPI analysis of Economic Policy Institute’s Current Population Survey Extracts, Version 2025.12.18.
[35] Ibid.
[36] Economic Policy Institute, “State Unemployment by Race and Ethnicity,” Updated December 2025.
[37] Economic Policy Institute, State of Working America Data Library, “Unemployment rate,” 2025.
[38] Economic Policy Institute, State of Working America Data Library, “Underemployment rate,” 2025.
[39] Jhacova Williams and Valerie Wilson, “Black workers endure persistent racial disparities in employment outcomes,” Economic Policy Institute, August, 27, 2019.
[40] Caitlin Schnur, “A Quality Job Guarantee Would Ensure DC Youth Can Fully Participate in DC’s Economy,” DC Fiscal Policy Institute, December 4, 2024.
[41] DCFPI analysis of Economic Policy Institute’s Current Population Survey Extracts, Version 2025.12.18. A three-year average sample was used for analyzing both the labor force participation rate and unemployment for Black youth due to sample sizes.
[42] Martha Ross, Kristin Anderson Moore, Kelly Murphy, et al, “Pathways to High-Quality Jobs for Young Adults,” Brookings Institute and Child Trends, October 2018.
[43] Economic Policy Institute, “Family Budget Calculator,” January 2025
[44] US Census Bureau, American Community Survey, “Median Income in the Past 12 Months (in 2024 Inflation-Adjusted Dollars),” 2024.
[45] Esther Colón-Bermúdez, Dan Emmanuel, Raquel Harati, et al, “Out of Reach: The High Cost of Housing 2025,” National Low Income Housing Coalition, 2025.
[46] Zielinski, Connor and Mychal Cohen, “Nearly Half of All Renters and More Than Half of Black Renters in DC Struggle to Afford Rent” DC Fiscal Policy Institute, April 14, 2025.
[47] Council of the District of Columbia Office of the Budget Director, “District of Columbia Economic Snapshot,” December 2025.
[48] The Urban Institute, “The American Affordability Tracker,” October 28, 2025.
[49] US Census Bureau, American Community Survey, “Food Stamps/Supplemental Nutrition Assistance Program (SNAP),” 2024.
[50] Matthew P. Rabbitt, Madeline Reed-Jones, Laura J. Hales, and Michael P. Burke, “Household Food Security in the United States in 2023,” US Department of Agriculture, Economic Research Service, September 2024.
[51] The Urban Institute, “The American Affordability Tracker.”
[52] United Way NCA, The Childcare Cost Burden for Low-Income Households Around the U.S., October 14, 2023.
[53] Economic Policy Institute, State of Working America Data Library, “Real hourly wage (2024$),” 2025.
[54] DCFPI analysis of Economic Policy Institute, State of Working America Data Library, “Real hourly wage (2024$),” 2025.
[55] Ibid.
[56] Sebastian Martinez Hickey and Emma Cohn, “D.C. Council should support tipped workers by maintaining I-82,” Economic Policy Institute, July 24, 2025.
[57 Institute for Women’s Policy Research, “Fact Sheet: Want to Help Women? Get Rid of the Tipped Minimum Wage. The Impact of Tipped Minimum Wage on Servers by State, Race, and Ethnicity,” December 2024.
[58] Sam Berger and Jacob Leibenluft, Trump Administration’s Mass Layoffs of Federal Workers Are Illegal, Center on Budget and Policy Priorities, May 2, 2025.
[59] Dana Hedgpeth, Federica Cocco, and Katie Shepherd, “D.C. region saw more than 72,000 federal jobs lost in 2025, new data shows,” The Washington Post, January 8, 2026.
[60] Economic Policy Institute, “How many federal employees live in your state?,” accessed November 21, 2025.
[61] Amanda Iacone and Jorja Siemons, “Deloitte Cuts Darken Outlook for US Government Consulting Work,” Bloomberg Tax, April 9, 2025.
[62] Valerie Wilson, “Black federal workers by state,” Economic Policy Institute, April 9, 2025.
[63] Sarah Jarvaid, “Attacks on the Federal Workforce Target Women and People of Color,” National Women’s Law Center, May 2025.
[64] Katherine Gallagher Robbins and Areeba Haider, “Trump’s plan to decimate the federal workforce will harm disabled workers, veterans, women of color & the economy,” National Partnership for Women and Families, January 2025.
[65] Jarvaid, 2025.
[66] Jarvaid, 2025.
[67] Andrea Sachs and Federica Cocco, “D.C. tourism was already struggling. Then the National Guard arrived.” The Washington Post, August 29, 2025.
[68] DC Office of the Chief Financial Officer – Office of Revenue Analysis, “Economic and Revenue Trend Reports, September 2025,” October 28, 2025.
[69] Brookings Institution, DMV Monitor, data on resident spending, visitor spending, and hotel revenue per available room accessed December 16, 2025; Tracy Hadden Loh and Glencora Haskins, “Consumer spending and visitor demand in the Washington, DC region are dropping,” Brookings Institution, December 12, 2025.
[70] Tim Carman and Warren Rojas, “ICE detentions roil D.C.’s already struggling restaurant scene,” The Washington Post, September 10, 2025.
[71] Matt Gregory, “DC restaurants navigate worker shortages amid immigration crackdown,” WUSA9 News, September 3, 2025.
[72] Chloe East, et al, “The Labor Market Effects of Immigration Enforcement,” Journal of Labor Economics, Vol. 41, No. 4, October 2023.
[73] Immigration Research Initiative analysis of the 2023 American Community Survey, one-year data.
[74] Immigration Research Initiative analysis of the 2023 American Community Survey five-year data.
[75] US Bureau of Labor Statistics, Local Area Unemployment Statistics, “Over-the-Year Change in Unemployment Rates for States,” January 2026.
[76] DC Chief Financial Officer Glen Lee, “September 2025 Revenue Estimates,” September 30, 2025.
[77] Center on Budget and Policy Priorities, “Harmful Republican Megabill Fails Families, Children, and Communities,” May 29, 2025.
[78] In December 2025, DC’s Chief Financial Officer certified a contingency list of items the Council wanted funded if revenue was sufficient, which restored some of the cuts to services provided through the Healthcare Alliance. However, the eligibility restrictions that kicked many people off the benefit as of October 1, 2025 remain in place.
[79] Economic Policy Institute, State of Working America Data Library, “Unemployment rate,” 2025.
[80] Ibid.
[81] Economic Policy Institute, State of Working America Data Library, “Long-term unemployment rate,” 2025.
[82] Austin Nichols, Josh Mitchell, and Stephan Lindner, “Consequences of Long-Term Unemployment,” Urban Institute, July 2013.
[83] Economic Policy Institute, State of Working America Data Library, “Labor force participation rate,” 2025.
[84] Economic Policy Institute, State of Working America Data Library, “Underemployment rate,” 2025.
[85] Schnur, 2024.
[86] Sarah Berger Gonzalez, Allison Thompson, Amy Castro, et al, “A Policy Framework for Guaranteed Income and the Safety Net,” Center for Guaranteed Income Research, November 2024.
[87] Although CareerMAP can help boost participants’ income, it is not considered a guaranteed income program, because participants only receive program benefits such as lower rent and cash if they increase their income and lose some of their benefits due to employment.
[88] For a detailed analysis of the features of Career Map and Strong Families, Strong Futures, see: United Planning Organization, “DC Pilot Programs Hold Great Promise to Improve Economic Security and Family Outcomes,” March 2023.
[89] Anne Gunderson, “Expanding Child Care Subsidies Would Boost the District’s Economy,” DC Fiscal Policy Institute, July 17, 2024.
[90] Ibid.
[91] Under 3 DC, “FY 27 Budget Letter to Mayor Bowser,” November 19, 2025.
[92] For more on increasing tax justice, see the Just Recovery DC’s People’s Tax Plan.