Executive Summary
The District of Columbia can use its economic development efforts to stem the tide of the city’s rising income inequality, but it is failing to do so. Instead, the District’s economic development efforts—including the enormous Wharf project—often support creation of low-wage jobs with minimal benefits, a lost opportunity to reduce inequities. By not including requirements to create high-quality jobs, the District encourages developers to compete for projects and profits by aggressively cutting labor costs—at the expense of workers’ ability to live in the District and support their families.
The redevelopment of DC’s Southwest Waterfront, marketed as the Wharf, is one of the largest real estate development projects in DC’s history. It has received $300 million in subsidies from the District government. Unfortunately, neither the developer nor the District’s economic development leaders took meaningful steps to ensure that the Wharf resulted in good-quality jobs or other benefits for DC residents. While the District set requirements for the developer to hire DC residents for some of the jobs, there were no requirements aimed at ensuring those jobs come with good wages and benefits. And while the District initially required the developer to set affordability standards for 30 percent of the newly built housing units, our elected officials later relented and allowed the developer to offer just over 10 percent of the units as affordable.
This project comes at a time when the District faces growing income inequality and skyrocketing housing costs that are pricing many families out of the city. The DC economy has boomed in recent years.[1] Yet the financial gains of DC’s boom economy have not been distributed equitably. In 2014, the average income of the top 5 percent of District households—roughly $500,000—was 54 times the average income of the bottom 20 percent of $9,900.[2] Poverty rates have not budged—some 120,000 DC residents, or 19 percent of the population, lived in poverty in 2016.[3]
There is a better way than this low-road approach. The city can require developers to create jobs for DC residents that allow them to keep up with DC’s rapidly rising cost of living and to share in the city’s unprecedented prosperity. In particular, the District should use its economic development to promote high-road development, in which employers create good-quality jobs and invest in their workers, which in turn results in skilled workers, low turnover and high-quality products.

High-road development is associated with higher wages and benefits, reduced incidents of wage theft and boosts to the local economy when workers spend their additional earnings. Research shows that high-road development is good not only for workers, but for employers, too, because it helps ensure that projects are completed in a timely way and with high quality.
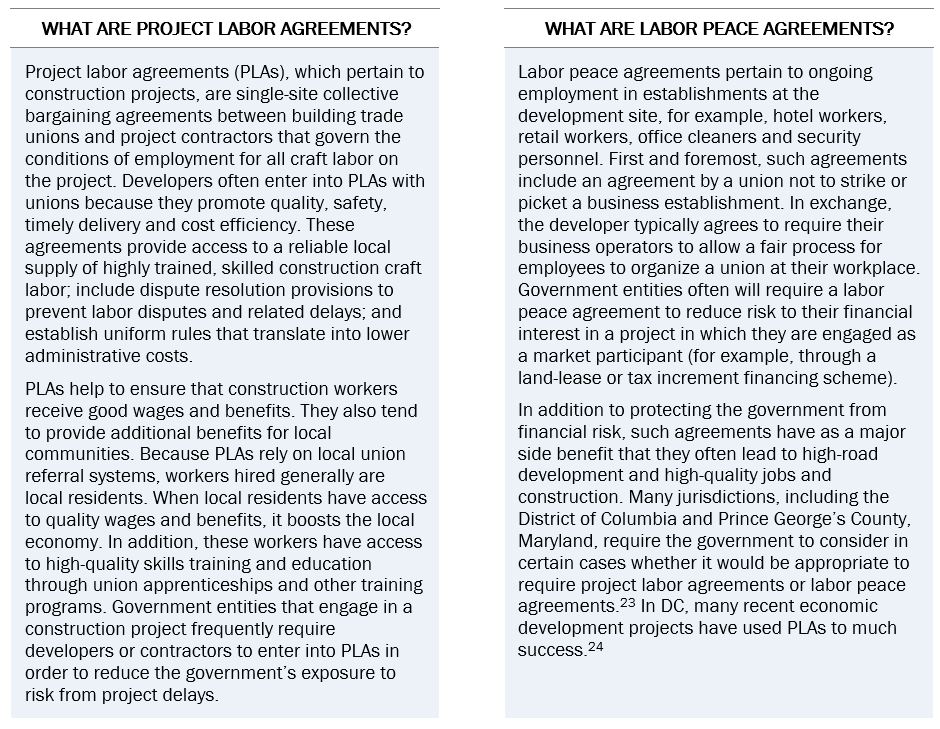
An essential component of high-road development is collaboration with labor unions. Many high-road developments start with project labor agreements—agreements between the building trades and project developers that govern the conditions of employment for the project and create project management efficiencies—during the project’s construction phase. While some construction workers at the Wharf were represented by a union, many others were not.
Once the construction is complete, employees of the businesses located at the development site may want union representation as well. Labor peace agreements are agreements by project developers that allow unions to engage with workers at a given worksite who may want to organize a union.
Unfortunately, the Wharf did not include a project labor agreement, labor peace agreements or any arrangement to work with local trade unions.
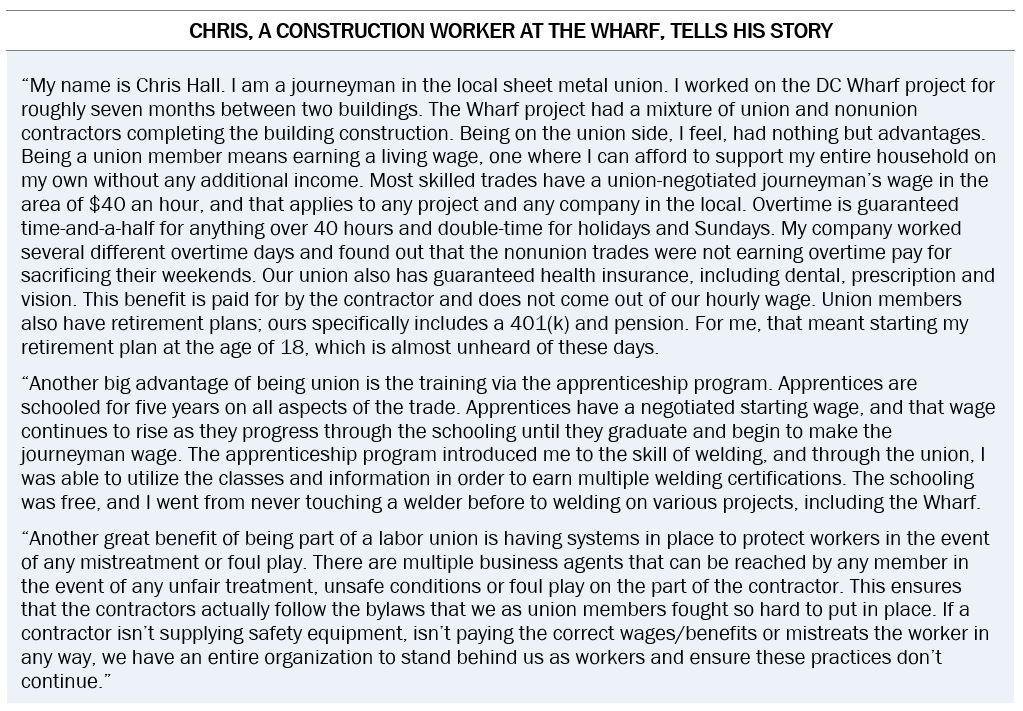
The impact of the District allowing projects such as the Wharf to take a low-road approach is substantial. Many jobs at nonunion construction sites pay less than $15 an hour, or less than $30,000 a year. Wages this low make it hard for workers to afford housing and provide a stable and supportive environment for their families. By contrast, unionized construction jobs often pay well above $20 an hour and include employer-paid health insurance and pension benefits.
This report analyzes the potential effects of unionization for all eligible workers associated with the Wharf. We find that if the developers and businesses associated with the project had worked with unions to develop project labor agreements for the construction phase and labor peace agreements for ongoing operations:
- Workers at the Wharf would have earned $6,400 to more than $11,000 more per year, depending on their industry.
- In total, unionization at the Wharf would mean more than $13.2 million in additional earnings annually for construction workers, hotel workers and office cleaners.
- Workers at the Wharf would have had critical benefits, including retirement and health care.
The fact that the Wharf project did not involve union agreements is a profound missed opportunity. The District government has spent enormous resources to fund the project while asking for very little in return. Specifically:
- The District provided close to $300 million in subsidies and expenditures to support the Wharf redevelopment. Yet it failed to determine whether this financial support was necessary in the first place or whether private funding to cover a larger share of the development’s costs could have been secured instead.
- The Wharf project provided very little affordable housing. The number of required affordable units was capped, and the city allowed additional units to be sold at much higher prices, to people at much higher income levels.
Even as the DC economy has expanded, income inequality has continued to worsen. Going forward, when developers pursue economic development projects with the assistance of the District government, the city should choose high-road development so that all workers—and the broader economy—can see the maximum benefit from these activities and the city’s residents will see more wage equality. Specific policy recommendations are made in the final section.
Background on the Wharf
The Wharf Is One of the Largest Development Projects in DC History
The Wharf redevelopment project is one of the largest in DC’s history. The total cost of the project will be $2 billion. Over two opening phases, it will include:
- At least 675 hotel keys, including:[4]
- Intercontinental (278 keys), expected opening October 2017[5]
- Canopy by Hilton Hotel (175 keys), expected opening January 2018
- Hyatt House Hotel (237 keys), expected opening December 2017
- 1,375 residential units[6]
- 6,000-seat indoor concert venue[7]
- 335,000 retail square feet[8]
- 945,000 office square feet[9]
DC Government Has Invested Substantial Money into the Wharf
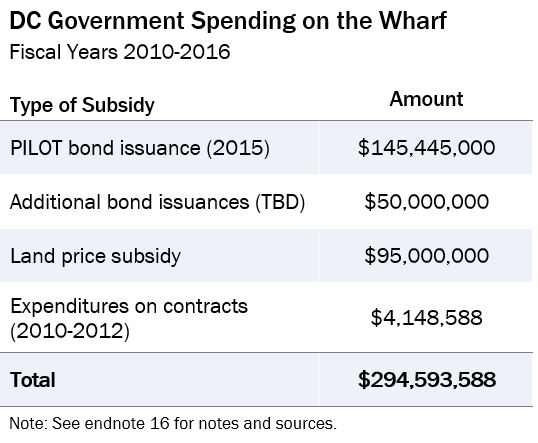
DC government subsidized a substantial portion of the project’s $2 billion price tag. A total of $198 million in tax increment financing and payment in lieu of taxes financing was allocated to the project by District government, as well as a $95 million land subsidy and nearly $5 million in contract expenditures through the Office of the Deputy Mayor for Planning and Economic Development.[10] The TIF/PILOT and land subsidies in effect represent grants from the District to this project.
In 2008, the city passed a law to designate 23 acres of land on the Southwest Waterfront of the District as the Southwest Waterfront PILOT/TIF Area.[11] Some $198 million was pledged to issue bonds to finance the project. A first round of bonds was issued in 2015 for a total of $145,445,000. The DC Office of the Chief Financial Officer expects additional rounds of bonds to be issued in the future.[12]
Under the Southwest Waterfront Bond Financing Act of 2008, the new tax revenue from the project—property taxes, plus sales tax in the case of TIF—goes to repay the bonds rather than into the District’s coffers. A baseline amount of $945,000 in taxes from the project will go into general revenues annually (the same amount of money that the District was collecting in taxes prior to the area’s redevelopment), but tax collections above that amount are deposited into the Southwest Waterfront Fund to repay the TIF and PILOT bonds. This means that the subsidy diverts tax revenue that otherwise would be available to support schools, health care, public safety or other city functions. As of April 2017, some $7.6 million had been deposited into the fund.[13]
In addition to nearly $200 million in direct cash subsidies, the District government offered the Wharf developers a free 99-year lease of city-owned land that was valued at $95 million at the time of disposition.
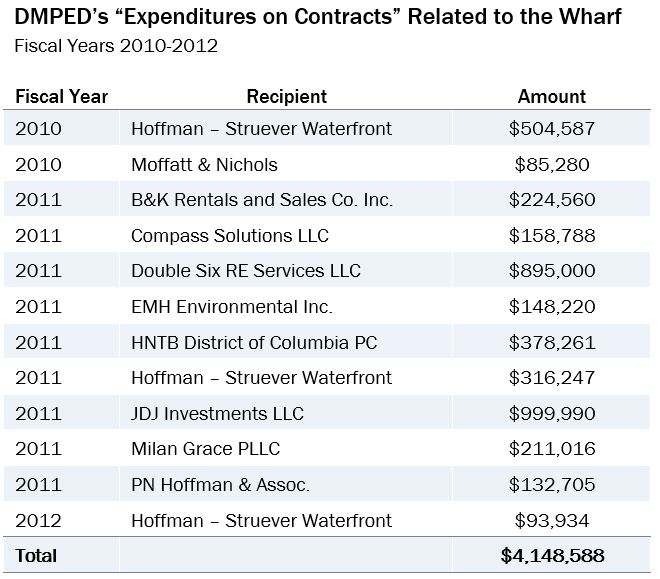
Also, between 2010 and 2012, the Office of the Deputy Mayor for Planning and Economic Development spent nearly $4.5 million on “expenditures on contracts” related to the Wharf project. Detailed information on the purpose and use of this funding is currently unavailable.[14]
Many economists question the overall need for the government to subsidize economic development projects. Research shows that economic development subsidies often do not bring jobs or economic activity that otherwise would not have occurred.[15]
There are especially serious questions about the need for government subsidies for the Wharf because the District awarded the substantial subsidies before the developer documented that any subsidy was needed. The DC Office of the Chief Financial Officer (OCFO) noted that the city committed to nearly $200 million before the developer made a commitment for how much it would invest in the project and before it tried to line up private financing for any loans needed to complete the project. Government economic subsidies normally are provided only after a private developer makes the case they are needed to “fill the gap” that cannot be filled by private equity and loans. Such a process helps ensure that the public subsidy is truly needed—that the project would not move forward but for the subsidy—and that the amount is justified. In the case of the Wharf, the reverse happened: DC government committed to the $198 million “and the developer is subsequently going to seek equity and debt partners to fill the gap,” according to the OCFO.[16] It therefore is unclear whether government money was needed at all or how much was appropriate if indeed some subsidy was needed.
Affordable Housing Requirements
The Wharf will result in about 1,400 new housing units, yet only 150 will be affordable, despite the District’s heavy subsidies.
Plans for the Wharf development originally included a requirement that 30 percent of residential units be set aside as affordable. Half of all affordable units were to be set aside for households at 60 percent or less of DC’s area median income (AMI), or $52,140 for a family of two. The other half were for households at 30 percent or less of AMI, or $26,070 for a family of two.[17] This translates into rents of $661 to $1,300 per month.[18]
However, legislation passed in 2011 limited that requirement to the initial 500 units of planned housing and allowed the developer to build additional residential housing under a much looser affordability requirement known as workforce housing. As this report shows, few of those who work at the Wharf will be able to afford the workforce housing.
Under the agreement, the developer will reserve 20 percent of the housing beyond the initial 500 units as “workforce” housing. For the first 80,000 gross square feet of housing beyond the initial 500 units, 20 percent of that housing (or 16,000 gross square feet) must be reserved as affordable to households earning 100 percent of AMI. That translates to a household income of $87,000 for a two-person household and a rent of $2,100 per month for a one bedroom unit. After 80,000 gross square feet of housing beyond the initial 500 units, the developer must reserve 20 percent of any additional housing as affordable to households earning 120 percent of AMI. That means a two-person household income of $105,000 and monthly rent of $2,400 per month for one bedroom.
This cannot really be considered affordable housing, especially because it is very close to market rent in the neighborhood. For instance, one-bedrooms at The Channel (950 Maine Ave. SW) go for $2,500 to $2,600.
This means that only about 10 percent of the 1,400 units being developed are truly affordable housing (30 percent of the first 500 units, or 150 homes).
High-Road Development Can Help Address the City’s Growing Income Inequality
As the District of Columbia expands economically—and especially when the city subsidizes development projects with public money—progressive economic development policies can be used to address the District’s growing income inequality. This means ensuring that developers choose high-road development over low-road development. Unfortunately, the District does not push consistently to ensure that economic development projects take the high road, leaving a low road as the default that most developers take, including at the Wharf.
In the low-road approach, businesses compete solely based on price. The basic strategy includes aggressive cost-cutting—including wages and benefits for workers. Additional strategies include deregulation, opposition to labor unions and targeted corporate subsidies. A large body of research has shown that this approach is ineffective[19] and can lead to lower-quality projects and lower-quality jobs—effectively, a “race to the bottom” among contractors competing for work.
In the high-road approach, on the other hand, government seeks to create an environment where high-quality businesses can thrive.[20] Such an environment includes a diverse, highly skilled workforce, robust infrastructure, a high quality of life, and effective and transparent governance. High-quality businesses demand a skilled workforce, so the high-road approach also tends to create high-wage, high-quality jobs. The high-road approach has been demonstrated to be just as profitable as the low-road approach. In return for higher wages and benefits, employers get work that is higher quality and more likely to be on time, workers are more productive, and turnover is reduced—all of which are critical for advanced businesses to compete effectively.[21]
This approach is a natural fit for a jurisdiction such as the District, which already has a well-educated workforce, good transit and physical infrastructure, a high quality of life and strong environmental protection.
The only way for the District to ensure that its economic development policies follow the high-road approach is to close off the low-road approach. In projects such as the Wharf, this means taking steps to ensure that when subsidies are provided to private development, these projects create high-quality, well-paying jobs.
Labor unions are essential in the creation and maintenance of high-quality jobs. Perhaps the biggest and most well-known effect of unionization is that unions bring higher wages through contract negotiations with employers. One study found that among very similar workers, union representation raises wages by an average of 23 percent.[22] Efforts to promote high-wage jobs at the Wharf could have had dramatic impacts on workers there, namely:
- Union labor during construction would have increased workers’ earnings by almost $10,000 per year.
- Workers in the completed hotels, office buildings and other sites would earn $6,000 to $6,800 more per year if they had been represented by a union.
- Unionized workers at the Wharf would have received employer-paid health insurance and retirement benefits, while the nonunion workers there likely get few or no benefits.
Unionization tends to provide other benefits as well, including:
- Reduced income inequality.
- Higher skilled labor, which leads to reduced workplace accidents and project timeline delays.
- Clear, enforceable rules in the workplace, which ensure fairness and safety.
- Reduced wage theft on the part of employers.
By closing the low road of competition on the sole basis of price, unions put the region on a path toward sustainable, broadly shared growth. One common way for workers to secure union jobs or organize a union at their workplace is though project labor agreements and labor peace agreements. These agreements can ensure that workers in the construction phase and ongoing operations phase of economic development projects receive quality wages and benefits, and that projects are held to safety and other accountability standards (see boxes below).
Unfortunately, the Wharf redevelopment project did not include project labor agreements or labor peace agreements. This is regrettable because our analysis shows that these agreements would have ensured a higher standard of living for the hundreds of workers at the Wharf, both during construction and ongoing once the businesses are open. By doing so, they would have helped to stem the tide of the city’s growing income inequality.
Increased Unionization Can Reduce Income Inequality
When more workers are unionized, income inequality tends to be reduced. Unfortunately, in the last few decades, the reverse has occurred, both in the United States and internationally. A recent paper from the International Monetary Fund (IMF) finds that the decline of unionization since the 1980s has led to increased income inequality in nearly every advanced economy around the world.[25]
Lack of unionization is associated with higher income inequality because when fewer workers are unionized, they have less power over their employers. Lower union density reduces workers’ bargaining power to demand things such as a livable wage and quality benefits.[26]
The IMF paper finds that the increase in income inequality across Organization for Economic Cooperation and Development countries is not only detrimental to working people, but also stymies broader economic growth.
Higher Wages for Union Workers[27]
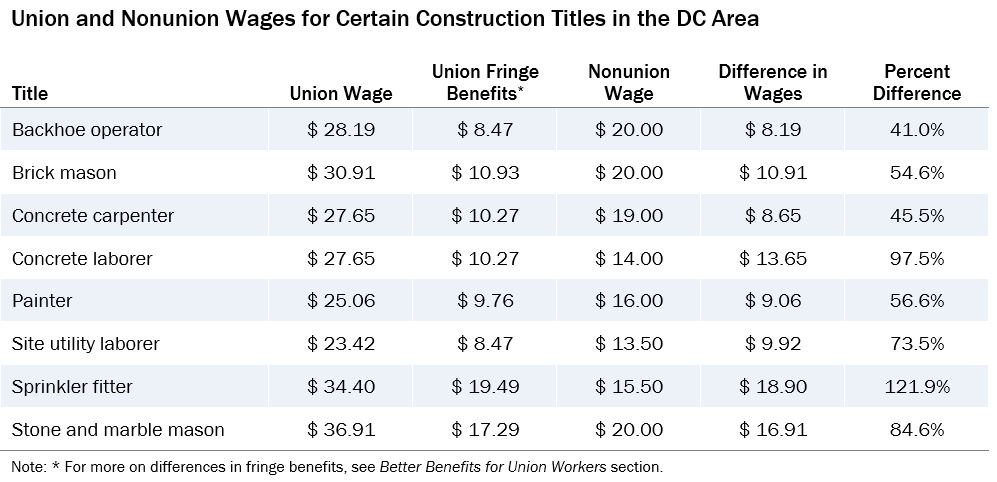
When workers have union representation at economic development projects such as the Wharf, their wages are much higher. A review of wage rates from a sample of collective bargaining agreements at several trade unions in the Washington, DC, area shows that wages across the board are significantly higher than for nonunion workers with similar job titles—ranging from 20 percent higher to more than double the entire nonunion wage.[28] This is in line with academic research, which finds a significant union wage premium in the construction industry[29] (Table 2).
The wage rates for nonunion workers—often at or just barely above DC’s minimum wage—are not nearly enough to make ends meet in the District of Columbia. Both the Massachusetts Institute of Technology (MIT) and the Economic Policy Institute find that the Washington, DC, area has the highest cost of living in the country.[30]
According to MIT, the living wage in the District is $15.71 for a single adult; $21.84 for a married couple, both working, with two children; and $41.04 for a single parent with two children.[31] This is the hourly rate each adult must earn at a full-time job to support their family. MIT defines its living wage calculation as the “minimum income necessary to meet basic living expenses.” The researchers note that families below this income level are likely to “suffer consistent and severe housing and food insecurity.”
This analysis estimates the total wage gains that could have been had at the Wharf through unionization of all eligible workers. While some construction workers at the Wharf are represented by a union, many others are not. Because complete information on the total number of workers by occupational title and unionization status was not available, we were unable to assess the full value of unionization at the Wharf based on available data. Instead, this analysis uses data from the Occupational Employment Statistics and other data from the Bureau of Labor Statistics to estimate nonunion wages across occupations for industries associated with the Wharf redevelopment project: construction of buildings, traveler accommodation, grocery stores[32] and office cleaners. Applying estimates of the union wage effect to all eligible workers provides an estimate of average annual pay if all eligible workers were represented.[33]
This analysis shows that construction trades workers’ annual pay would have been an estimated $11,100 higher per year as a result of unionization. For hotel workers and office cleaners, average pay would have been between $6,400 and $7,600 higher per year (Table 3).
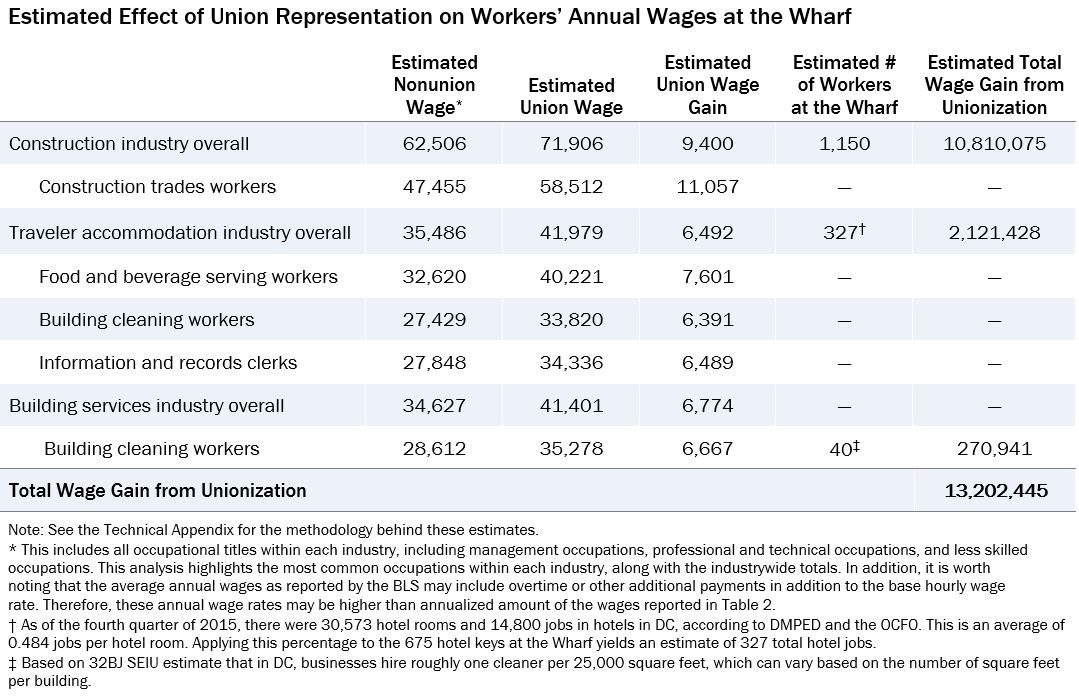
The positive effects of unionization are quite clear. For example, among construction trades workers, the estimated average annual nonunion wage is $47,455 (about $22.81 per hour). But for unionized workers, the wage rises to $58,512, or $28.13 per hour. For hotel workers, unionized workers receive a wage of $20.18 per hour on average—very close to the living wage for the family of four cited above—whereas nonunion workers receive only $17.06, which is not nearly enough to make ends meet to support a family.
Better Benefits for Union Workers
In addition, unionized workers are more likely to have access to employee benefits such as a retirement plan, health care, dental or vision coverage, paid sick days and other types of paid leave. These benefits are often exclusively paid for by the employer, leaving workers with little to no out-of-pocket costs (Table 2). Without unionization, workers often do not receive any workplace benefits or must pay their costs entirely out of pocket.[34]
These numbers are consistent with national research finding that unionized workers have much better benefit packages than nonunion workers. Unionized workers are 18 percent more likely to have employer-provided health insurance and 23 percent more likely to have a workplace retirement plan.[35] Represented workers also tend to have more generous benefits than their nonunion counterparts. For example, one study found that unionization raises the value of retirement and health benefits by 56 percent and 77 percent, respectively.[36] Having access to these crucial benefits increases workers’ financial stability and overall quality of life.
Had the Wharf redevelopment project mandated PLAs or LPAs, workers likely would have benefited substantially from both wage and benefit increases.
Project Labor Agreements Would Have Reduced the Incidence of Wage and Benefit Theft
Wage theft occurs when employees are not fully paid for the hours they have worked—by being paid lower wages than promised and/or mandated under minimum wage and overtime rules, by being denied legal benefits or even by not being paid at all.
Wage theft is a serious problem in the District. For example, a recent survey of restaurants in two popular DC neighborhoods found that a full three-quarters of businesses—40 out of 53—were consistently violating DC’s Sick and Safe Leave Act. Just 10 percent of surveyed workers at these restaurants (26 out of 265) had used one or more paid sick days effectively. Meanwhile, two-thirds of these workers (177 out of 265) had been denied a paid sick day by their employer.[37] Oftentimes this means workers show up to work sick because they feel they cannot afford to take even a single sick day, even when they are entitled to it.
It is likely that wage theft has been and will be a serious problem at the Wharf, although no data are available. That’s because wage theft in DC is most prevalent in the construction, restaurant and security industries—three sectors in which the Wharf has hired or will hire many workers.[38]
While it is widely understood that wage theft is common in the District, the volume of complaints on labor law violations made to the DC government is low, a sign that most violations go unreported. In 2016, there were just 167 complaints on the Minimum Wage Act, 40 on the Living Wage Act and 22 on the Sick and Safe Leave Act.[39] This seems to suggest that many workers in low-wage industries fail to report violations. This is probably because those who are most vulnerable to wage theft are not only less likely to know their rights but also less likely to come forward when they do.
When workers do come forward, the District has been weak in enforcing its labor laws. Of the complaints filed in 2016, not a single hearing or investigation was conducted regarding violations of the Wage Payment, Minimum Wage, Living Wage, and Sick and Safe Leave laws.[40] A recent report from the Office of the District of Columbia Auditor found that the city “does not have sufficient processes in place to prevent, detect, and/or correct violations of the Davis-Bacon Act” (the law mandating that contractors pay prevailing wages on government construction projects). The report found that this increases “the possibility of contractors shortchanging workers to increase their profits and/or lowering their bids.”[41]
One benefit of unionization is that it drastically reduces the incidence of wage theft. When workers have a union behind them, they have much stronger resources to file complaints with the employer and/or government enforcing agency. That is, unions provide workers with information about their workplace rights and procedures for remedy. They also facilitate actions such as limiting employer reprisals, correcting disinformation, aggregating multiple claims, providing resources to make a claim and negotiating solutions to disputes on behalf of workers.[42]
Higher rates of unionization at the Wharf could have substantially reduced incidents of wage theft, both in the construction phase and during the businesses’ ongoing operations.
Conclusion & Policy Implications
The District of Columbia government should do more to ensure that all economic development projects pursue high-road development so that District workers and residents experience the maximum benefits from these activities. Specifically, the District should:
- Ensure that any District-subsidized project is held to high job quality standards. This should include projects that receive direct subsidies, tax abatements or special zoning allowances. The District should ensure high-quality job standards through project labor agreements and labor peace agreements to protect the District’s investments when possible. Alternatively, the District can include provisions that developers pay workers prevailing wages and require specific job quality standards such as strong benefits and/or access to quality training programs.
- Fully fund the Procurement Integrity, Transparency, and Accountability Amendment Act of 2016, which was passed in 2016 but not implemented because of lack of funding. This law requires that city contracts above $75 million have a PLA.
- Mandate that all projects seeking zoning law variances, including planned unit developments, are subject to high-quality labor standards, as well as robust affordable housing provisions.
- Mandate more targeted local hiring for new workers on these projects and provide opportunities for workers to enroll in union apprenticeship programs. For example, a recent Los Angeles ordinance requires that 30 percent of construction workers be LA residents and that 10 percent live within a 5-mile radius of the project. The ordinance also requires that at least 60 percent of the construction workforce have graduated from a recognized union apprenticeship training program or have an equal number of hours of on-the-job experience.[43]
In addition, the District should provide more transparency in reporting what it is investing in these projects and better enforce its mandated contract provisions. Specifically, the District should:
- Create a publicly available and downloadable online database of all economic development subsidies and their details.
- Report projected and actual number of jobs created for each economic development project, associated wages and the share of jobs filled by DC residents.
- Add provisions to economic development deals to require recapture of subsidies when deals fail to meet predetermined standards.
By holding development projects to these standards, the District can boost the local economy in a way that benefits not only the developers and business owners but also the day-to-day workers who make these projects successful.
Technical Appendix
Comparison of Union and Nonunion Construction Wages by Occupational Title
To get a sense of the range of union wages and benefits, we compiled collective bargaining agreements from various local construction trade unions in the Washington, DC, area. We looked at the wage and benefit rates as of June 2017 and compared these with self-reported wage rates for nonunion workers in similar titles.[44]
For comparison, we checked these union and nonunion titles and associated wages against comparable titles and wages in the Occupational Employment Statistics data set from the Bureau of Labor Statistics, for workers in both the nonresidential construction and residential construction industries. Because the BLS data include both union and nonunion workers, we would expect the BLS wage to be somewhat higher than the nonunion wage but substantially lower than the union wage. Indeed, across each job title presented in the chart, this was what we found.
Estimation of Union and Nonunion Earnings by Industry and Occupation
The goal of this calculation is to estimate what average annual earnings for workers at the Wharf would be if none of them were represented by unions and what average earnings would be if as many workers as possible were represented. To do this, we adopt the methodology conducted by the Maryland Center on Economic Policy in its report “Taking the High Road in Prince George’s County: The Role of Worker Representation in Economic Development Strategies.”[45]
This estimation uses Occupational Employment Statistics (OES) and the Union Members Summary (UMS) from the Bureau of Labor Statistics (BLS), in addition to regional price parities from the Bureau of Economic Analysis.
The OES provides industrywide averages of wages, but simply using these is likely to be inaccurate. The industrywide average wage is a combination of union wages and nonunion wages. Because some workers in this industry are represented by unions and some are not, the OES wage is likely to be higher than the true average nonunion wage, meaning that any estimated union wage based on this number will be too high as well.
The UMS provides weekly wages of union and nonunion workers by broad industry and occupation. We can break down the union wage effect of a particular industry by applying the UMS union wage effect to the wages of each individual occupation within the industry. For each occupation within the traveler accommodation industry, for example, we solve the following equation for EioN:
Eio = poGoEioN + (1 – po)EioN
In this equation, Eio is the annual average wage for the specific industry and occupation being considered. po is the occupation-specific share of workers who have union representation, and Go is the occupation-specific union wage gap.[46] EioN, the variable to be estimated, is the industry- and occupation-specific average annual nonunion wage.
The next step is to build up the industrywide nonunion annual average wage by taking into account the nonunion wages by occupation, from the step above, for all of the occupations found in a particular industry, using the following equation:
EiN = Si1Ei1N + Si2Ei2N + … + SikEikN
This equation is in effect an average of the occupational wages, weighted by the significance of that occupation within the industry. In this equation, EiN is the industrywide average annual nonunion wage. Ei1N is the industry- and occupation-specific average annual nonunion wage for Occupation 1, and Si1 is the occupation-specific employment share for Occupation 1 in the industry under consideration. Ei2N and Si2 are the same for Occupation 2, and so on. k is the number of occupations in the industry. The average annual nonunion wage for each occupation is multiplied by the occupation’s employment share within the industry and summed to calculate the industrywide average nonunion wage.
Calculating the industrywide average union wage is slightly more complex because only workers in non-managerial, nonsupervisory occupations are expected to see wage gains from unionization. Thus, the industrywide average union wage is calculated by multiplying each occupation’s employment share by its average wage, but for some occupations this is a union wage while for others it is a nonunion wage. For each union title, we use the previously cited union wage premium of 23.2 percent.[47]
While more accurate than the BLS averages alone, this approach still needs two adjustments. First, we must adjust for the fact that unionization rates for a given occupation can vary from industry to industry. Second, the OES and UMS data are nationwide, so we must make an adjustment to account for geographic variation in wages.
Industry Union Adjustment
Workers in the same occupation but different industries may be unionized at different rates or may see different-sized gains in wages from unionization. This means that using occupation-wide data to estimate nonunion wages may yield inaccurate results. In other words, because the UMS provides only very high-level occupation data, these data could hide significant variation within broad occupation groups.
Similarly, workers in the same occupational group but different industries may see different gains in wages from unionization. A union in a heavily unionized industry may have more power to set wages than one representing similar workers in a less heavily unionized industry. As a result, the gap between union wages and nonunion wages may be different for workers in different industries, even if they all have the same occupation.
We cannot correct for all of these factors, but we partially correct for this problem by adjusting the occupational unionization levels and union wage gaps using the UMS industry-level data.[48]
Geographic Wage Adjustment
All calculations so far have been based on nationwide data, even though prices and wages differ significantly throughout the United States. Because the District of Columbia has higher prices and wages than many other parts of the country, nationwide data are likely to understate wages for workers in this area. To account for this, all wages were adjusted upward using the regional price parity for Washington, DC, published by the Bureau of Economic Analysis.[49]
[1] Chaz Rotenberg and Ilana Boivie, “Economic Powerhouse: DC Is Growing Faster Than the Region,” DC Fiscal Policy Institute, May 25, 2017, https://www.dcfpi.org/all/economic-powerhouse-dc-growing-faster-region.
[2] Wes Rivers, “High and Wide: Income Inequality Gap in the District One of the Biggest in the US,” DC Fiscal Policy Institute, March 13, 2014, https://www.dcfpi.org/wp-content/uploads/2014/03/3-13-14-Income-Inequality-in-DC.pdf.
[3] Claire Zippel, “DC Has More to Do to Ensure Residents of Color Can Access Growing Prosperity, Census Data Show,” DC Fiscal Policy Institute, September 15, 2017, https://www.dcfpi.org/all/dc-ensure-residents-color-can-access-growing-prosperity-census-data-show.
[4] The Wharf Investor Handout Fall 2015.
[5] “InterContinental Washington DC – The Wharf Opening This October,” Luxury Travel Advisor, June 20, 2017, accessed August 21, 2017, http://www.luxurytraveladvisor.com/hotels/new-jpr-client-intercontinental-washington-d-c-wharf-opening-october-2017.
[6] The Wharf Investor Handout Fall 2015.
[7] Shaun Courtney, “Developer Nears Finish of First Phase of Wharf Project in Southwest DC,” The Washington Post, February 26, 2017, https://www.washingtonpost.com/business/economy/developer-nears-finish-of-first-phase-of-wharf-project-in-soutwest-dc/2017/02/26/046a606a-f863-11e6-9845-576c69081518_story.html.
[8] The Wharf Investor Handout Fall 2015.
[9] The Wharf Investor Handout Fall 2015.
[10] Information on spending on The Wharf is unavailable prior to 2010, as Unified Economic Development Reports were not compiled and written prior to that year. Sources:
Unified Economic Development Reports from the OCFO, available at https://cfo.dc.gov/node/230922.
Testimony of John Ross, senior adviser to the CFO for Economic Development Finance, available at http://lims.dccouncil.us/Download/19016/B17-0591-CommitteeReport1.pdf.
[11] Detailed definitions of TIF and PILOT programs in the District of Columbia are available here: https://cfo.dc.gov/sites/default/files/dc/sites/ocfo/publication/attachments/ocfo_tif_retail_tif_pilot_tafa.pdf.
[12] Internal data supplied by the Office of the Chief Financial Officer, Office of Economic Development Finance.
[13] Internal data supplied by the Office of the Chief Financial Officer, Office of Economic Development Finance.
[14] District of Columbia Unified Economic Development Budget Report for Fiscal Year 2011, Office of the Chief Financial Officer, Office of Economic Development Finance, March 2012, https://cfo.dc.gov/sites/default/files/dc/sites/ocfo/publication/attachments/ocfo_FY11_Unified_Report_Main.pdf.
According to the OCFO, expenditures on contracts is defined as “District expenditures on contracts related to economic development, such as construction, planning and asset management services provided by third parties, and may include both operating and capital budget dollars.” Exact dollar amounts and recipients are listed in Technical Appendix Table A1, but no further information about these expenditures is currently available. When the issuing agency was asked for details on these contracts, it suggested filing a Freedom of Information Act request, which is still in process.
[15] Subsidy Primer: The effects of subsidies, Global Subsidies Initiative, http://www.iisd.org/gsi/effects-subsidies.
[16] Natwar M. Gandhi, “Fiscal Impact Statement: Southwest Waterfront Bond Financing Act of 2008,” May 16, 2008.
[17] The Wharf (Southwest Waterfront) Phase 1, Office of the Deputy Mayor for Planning and Economic Development, https://dmped.dc.gov/page/wharf-southwest-waterfront-phase-1. It should be noted that a public lands law adopted in fall 2014 now requires that half of affordable units be set at 50 percent AMI, rather than 60 percent AMI.
[18] Jonathan O’Connell, “Southwest Waterfront, Already Washington’s Biggest New Development, Will Double in Size,” The Washington Post, May 17, 2017, https://www.washingtonpost.com/news/digger/wp/2017/05/17/already-washingtons-biggest-new-development-the-southwest-waterfront-will-double-in-size.
[19] Michael Leachman and Michael Mazerov, “State Personal Income Tax Cuts: Still a Poor Strategy for Economic Growth,” Center on Budget and Policy Priorities, May 14, 2015, http://www.cbpp.org/research/state-budget-and-tax/state-personal-income-tax-cuts-still-a-poor-strategy-for-economic.
Robert Tannenwald and Iris J. Lav, “The Zero-Sum Game: States Cannot Stimulate Their Economies by Cutting Taxes,” Center on Budget and Policy Priorities, March 2, 2010, http://www.cbpp.org/research/the-zero-sum-game-states-cannot-stimulate-their-economies-by-cutting-taxes.
Elise Gould and Will Kimball, “‘Right-to-Work’ States Still Have Lower Wages,” Economic Policy Institute, April 22, 2015, http://www.epi.org/publication/right-to-work-states-have-lower-wages.
[20] Bill Schweke, “A Progressive Economic Development Agenda for Shared Prosperity: Taking the High Road and Closing the Low,” cfed, June 2006, http://beta.accesstofinancialsecurity.org/sites/default/files/HighRoadEconomicDevelopment_CFED-1354525948.pdf.
[21] Matthew Walters and Lawrence Mishel, “How Unions Help All Workers,” Economic Policy Institute, August 26, 2003, http://www.epi.org/publication/briefingpapers_bp143.
[22] Barry Hirsch and Edward Schumacher, “Unions, Wage, and Skills,” Journal of Labor Economics, 2002, quoted in Matthew Walters and Lawrence Mishel, “How Unions Help All Workers,” Economic Policy Institute, August 26, 2003, http://www.epi.org/publication/briefingpapers_bp143.
[23] Governments generally can require developers to enter into construction project labor agreements and post-construction labor peace agreements when the government has a “proprietary interest” in a project. Examples of proprietary interests include capital budget expenditures to help finance project construction, special revenues such as gaming revenue generated by a casino or the investment of public resources such as loan guarantees and property tax abatements. Ordinary government interests in economic development—such as property tax revenue or job creation—are not proprietary interests.
[24]Examples include the Gallery Place redevelopment, the Walter E. Washington Convention Center, Nationals Stadium, St. Elizabeth’s East Phase 1, the Lafayette Building, Portner Place, Frederick Douglass Memorial Bridge, Texas de Brazil Washington DC, the DC United Soccer Stadium and the Entertainment Sports Arena.
[25] Florence Jaumotte and Carolina Osorio Buitron, “Power from the People,” Finance & Development, Vol. 52, No. 1, March 2015, https://www.imf.org/external/pubs/ft/fandd/2015/03/pdf/jaumotte.pdf.
[26] Bryce Covert, “Fewer Labor Unions Means More Income Inequality,” Think Progress, February 27, 2015, https://thinkprogress.org/fewer-labor-unions-means-more-income-inequality-26ba1ea919fd.
[27] Higher unionization is also commonly associated with “spillover effects,” or the idea that nonunion wages can rise with increased union density. While unionization at the Wharf certainly could have had this effect on workers in the affected industries, because the proportion of the estimated number of workers at the Wharf to total employment in each industry in the DC area is relatively minimal, it is unclear whether unionization of the total number of workers employed at the Wharf would have increased nonunion wages in any significant way. We therefore do not attempt to calculate the spillover effect for the purposes of this analysis but do acknowledge that unionization could have had some small effect.
[28] For more details on these data sources, see the Technical Appendix.
[29] Cihan Bilginsoy, “Union Wage Gap in the U.S. Construction Sector: 1983–2007,” Industrial Relations, Vol. 52, Issue 3, June 19, 2013, pp. 677-701.
[30] Living Wage Calculation for District of Columbia, Massachusetts Institute of Technology, http://livingwage.mit.edu/counties/11001.
Family Budget Fact Sheets: Family Budgets in Washington, DC, Economic Policy Institute, http://www.epi.org/resources/budget/budget-factsheets/#/91.
[31] Living Wage Calculation for District of Columbia, Massachusetts Institute of Technology, http://livingwage.mit.edu/counties/11001. MIT defines the living wage as the hourly rate an individual must earn to support their family if they are the sole provider and are working full time. The calculations take into account local costs of typical expenses, including food, child care, medical care, housing, transportation and local tax rates.
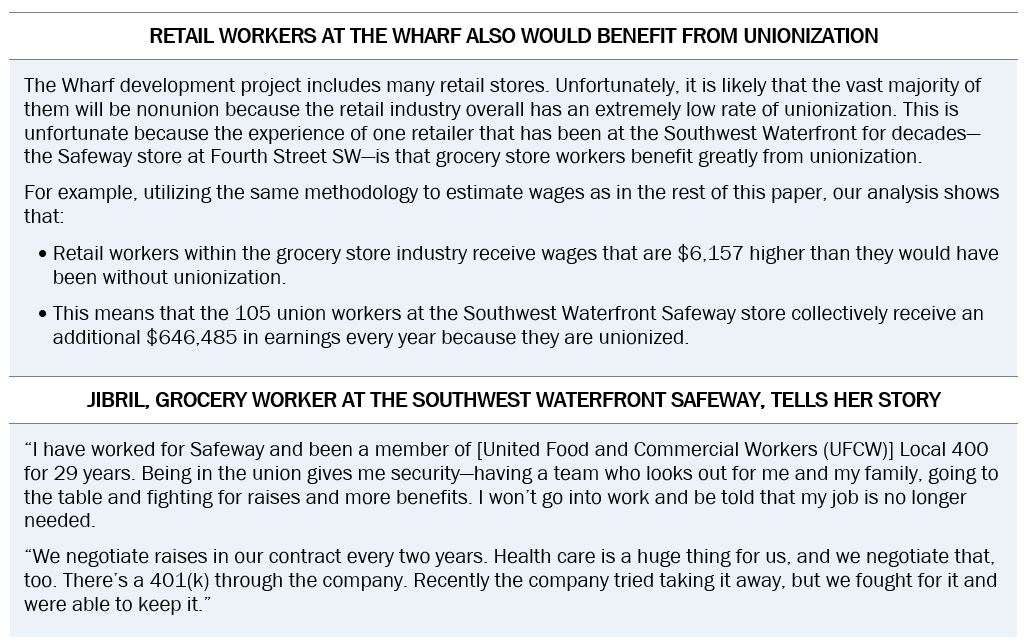
[32] There is currently one Safeway grocery store near the Wharf redevelopment, and it is already unionized. The Wharf project does not include plans to open another grocery store. For this reason, we do not include grocery workers in our estimate of increased unionization at the Wharf but discuss it separately as a benefit of unionization.
[33] See Technical Appendix for more details.
[34] Based on self-reporting from nonunionized workers in Washington, DC
[35] Brooks Pierce, “Compensation Inequality,” Bureau of Labor Statistics, Office of Compensation and Working Conditions, June 1999, quoted in Matthew Walters and Lawrence Mishel, “How Unions Help All Workers.”
[36] Matthew Walters and Lawrence Mishel, “How Unions Help All Workers,” Economic Policy Institute, August 26, 2003, http://www.epi.org/publication/briefingpapers_bp143.
[37] Paid Sick Leave Compliance Survey Project, DC Jobs with Justice, 2016.
[38] “Stolen Wages in the Nation’s Capital: Fixing DC’s Broken Wage Theft Claims Process,” Employment Justice Center, 2014.
[39] Department of Employment Services Performance Oversight Responses, #2, 2017, pp. 53-62. Totals are the result of summing the number of complaints that remain open, plus those in which an initial determination has been made, plus those closed with an initial determination and those closed without an initial determination.
[40] Department of Employment Services Performance Oversight Responses, #2, 2017, pp. 53-62.
[41] Kathleen Patterson, “The Department of General Services Needs Guidance and Assistance to Develop Effective Internal Controls,” Office of the District of Columbia Auditor, July 17, 2017, http://www.dcauditor.org/sites/default/files/DGS.Internal.Controls.Final_.Report.7.17.17.Web_.pdf.
[42] Matthew Walters and Lawrence Mishel, “How Unions Help All Workers,” Economic Policy Institute, August 26, 2003, http://www.epi.org/publication/briefingpapers_bp143.
[43] City of Los Angeles Initiative Ordinance JJJ, “Affordable Housing and Labor Standards Related to City Planning,” November 2016.
[44] Surveys conducted by Laborers (LIUNA) organizers. A total of 151 workers were surveyed, with 142 giving salary information.
[45] Available at http://www.mdeconomy.org/taking-the-high-road-in-prince-georges-county.
[46] Note that po and Go, as reported in the UMS, are not industry-specific.
[47] Barry Hirsch and Edward Schumacher, “Unions, Wage, and Skills,” Journal of Labor Economics, 2002, quoted in Matthew Walters and Lawrence Mishel, “How Unions Help All Workers,” Economic Policy Institute, August 26, 2003, http://www.epi.org/publication/briefingpapers_bp143.
[48] We do not make this adjustment for the traveler accommodation industry because the unionization levels calculated per the OES and reported by the UMS are nearly exact. We do not make this adjustment for grocery stores either, because unionization rates for the retail industry as a whole, as reported by the UMS, are drastically lower than they are for grocery stores (as reported by the Current Population Survey), which constitutes an incredibly small proportion of the overall industry, so the UMS unionization rate is highly inaccurate.
[49] The BEA defines regional price parity as a measure of “the differences in price levels across states and metropolitan areas for a given year and are expressed as a percentage of the overall national price level. All items RPPs cover all consumption goods and services, including rents.”