![]()
Incomes rose and the official federal poverty level (FPL) declined in 2019, according to new American Community Survey Census data released this week. This finding comes with the caveat that the FPL has many shortcomings: it is antiquated, uses pre-tax income, and fails to account for geographic differences. The FPL’s largest shortcoming is that it is a stingy measure—that is, it severely underestimates what it costs for families to make ends meet.
In addition, the Census collected this data prior to the COVID-19 pandemic and resulting recession, and they bear little resemblance to economic conditions today. Hardship has spiked over the past six months, particularly among Black, Latino, and immigrant households, and households with children. This disproportionate harm reflects harsh, longstanding inequities—often stemming from structural racism—that the current crisis is exacerbating.
Nevertheless, the data show that even in overall good economic times, DC’s economy is marked by racial inequalities, which undermine stronger economic growth and the likelihood of truly inclusive economic recovery. Here are 5 takeaways from the Census’ new 2019 poverty and income data for the District:
1. DC’s poverty rate remains alarmingly high. Affording the basics, such as rent, food, and utilities was a daily challenge for many DC residents living in poverty last year. Approximately one in seven District residents, or 90,500 people, earned poverty-level incomes in 2019. That’s more than two times the number of fans who can fit in the Nationals baseball stadium. The share of residents living in poverty—about $26,000 per year or less for a family of four—decreased from 16.1 percent in 2018 to 13.5 percent in 2019, under the official poverty rate. The decline was likely a result of a growing economy, a tight labor market, and increases in wages for minimum wage and low-wage workers.
Unlike the FPL, the Supplemental Poverty Measure (SPM), with shortcomings of its own, accounts for differences in housing costs across the US, taxes, non-cash benefits such as rent subsidies, and cash assistance such as Social Security. The SPM also considers out-of-pocket medical costs and work expenses like child care. When these costs are factored in, a much larger share of the District’s population is living in poverty: 16.7 percent under the SPM, compared to 13.7 percent under the FPL, using a three-year average. (SPM data for DC and other states is only available using a three-year average, whereas the American Community Survey data is robust enough for one-year averages.)
2. Poverty has the tightest grip on Black residents in DC. Roughly 67,100 Black residents—21.6 percent—lived in poverty in 2019 under the FPL measure. This is far greater than the 8.8 percent of (or 6,600) Latinos and 5 percent of (or 12,300) non-Hispanic whites living in poverty. In “Chocolate City,” Black residents face the double burden of having the highest, most persistent poverty rates andliving in high-poverty areas. These outcomes illustrate the economic harm caused by structural racism, as well as the urgent need to remove economic barriers holding back people of all backgrounds who are doing their best to get by.
3. Child poverty is an urgent, unmet crisis. Some 18.9 percent of DC children lived in poverty in 2019—well above the city’s overall poverty rate—under the FPL measure. There are devastating consequences for 23,400 children growing up in poverty—the vast majority of whom are Black. Children experiencing poverty tend to be worse off in a range of ways, including being more likely to enter school behind their peers, scoring lower on achievement tests, working less and earning less as adults, and having worse health outcomes.
DC Public Schools and most public charter schools are operating on a fully remote basis until at least November 6, 2020. Lower-income, Black and Latinx children are more likely to be harmed by distance-only learning, a June report from McKinsey & Company found. The average learning loss for students is seven months if in-school instruction does not resume until January 2021, the report said. However, Black students may fall behind by 10.3 months, Hispanic students by 9.2 months, and low-income students by more than a year.
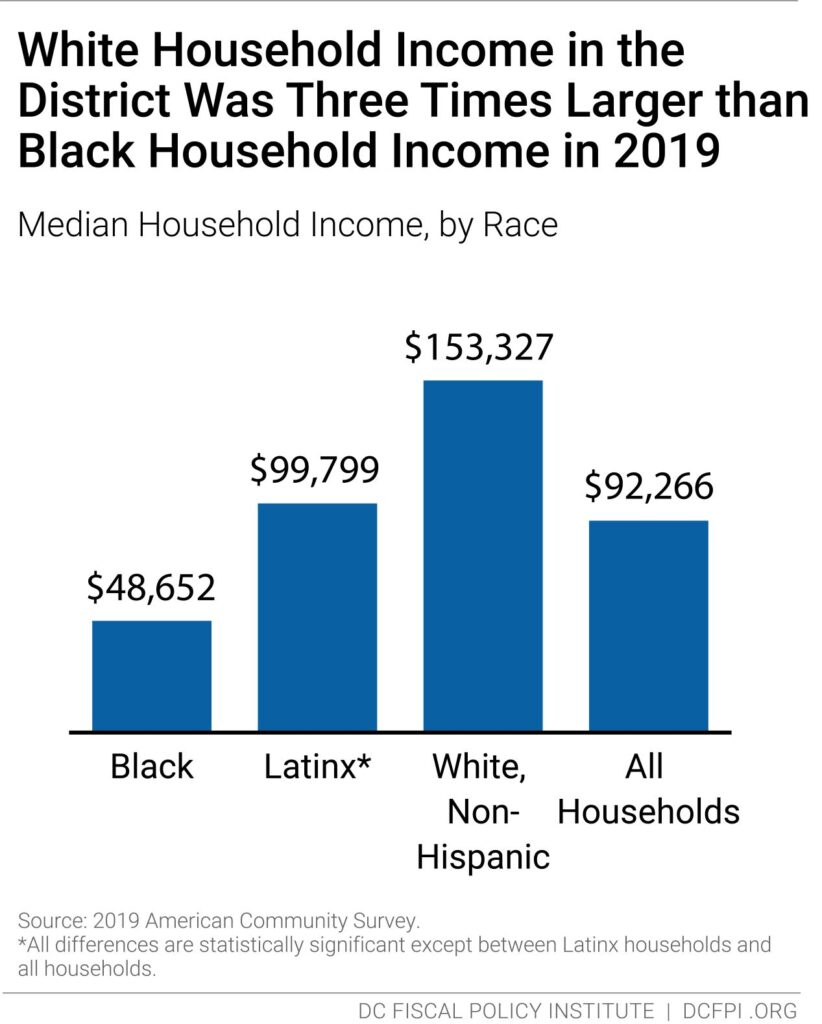
4. Household incomes rose but racial disparities persist. The median income for all DC households increased to $92,266 from $86,700 in 2019 (adjusted for inflation). Half of all DC households have incomes above the median income and half have incomes below it. White households have the highest median income in the District at $153,300—more than three times the Black median income and 1.5 times as large as the Latinx median income. Persistent racial income disparities among the city’s residents require District policymakers to do more to improve access to economic opportunity for Black residents in particular.
5. The benefits of economic growth are overwhelmingly concentrated at the top. The top 20 percent of households in the District had an average income of nearly $362,000 in 2019—26 times larger than the average income for households in the bottom 20 percent and nearly four times larger than the average income for the middle 20 percent. Moreover, the top 20 percent of households had more income than the entire bottom 80 percent of households combined.
So, while the DC economy was booming in 2019, we know that the economic growth was not widely shared. This reflects entrenched systemic racism and a broken economic model that often stacks the deck against the least among us. When the COVID-19 pandemic and resulting recession blew a gaping hole in our economy, a wide swath of DC residents were thrown into economic distress and had little or no assets to fall back on. The Census Bureau is now releasing real-time snapshots that allow us to track economic hardship since the pandemic hit. This data shows alarming rates of hardship among DC. For the period from July 9 through July 21:
- About 63,000—12 percent of all adults in the District—reported living in a household where there was not enough food to eat in the last seven days. The rate more than doubled to 25 percent for adults in DC households with children, well above the pre-pandemic figure.
- An estimated 26,000 DC adults who lived in rental housing—11 percent—were behind on rent.
- Half of the District’s children who live in renter households were in households that were not getting enough to eat, behind on rent, or both, for the survey period between June 18 to July 21.
The federal aid disbursed to date will not help the District respond to the economic crisis in an adequate way, and it is increasingly unlikely that any states will receive any additional federal assistance in 2020. This is unacceptable because people are hurting now; DC is facing looming crises in hunger, homelessness, and eviction. In the absence of Congressional action, DC lawmakers need to step up with a strategy to increase revenue this fall to fund anti-poverty programs that provide consistent, monthly relief. Otherwise, poverty and hardship are likely to worsen and move DC further away from the improving conditions of 2019.