The District’s affordable housing crisis poses significant long-term risks to the stability and well-being of the city’s lowest income residents—those with incomes below 30 percent of the area median, or $32,000 for a family of four. To address this serious problem, the District should substantially increase housing assistance for such residents.
The virtual disappearance of low-cost housing in DC means that most extremely low-income residents are forced to spend the majority of their income on rent. For residents working in low-wage jobs or relying on modest fixed incomes from public benefit programs, keeping a roof overhead can take 80 percent or more of their monthly income.
Such high housing cost burdens cause serious problems. Families living in unaffordable housing are at higher risk of being evicted, moving frequently, living in crowded or substandard conditions, or becoming homeless. When households are forced to move, it often starts a downward spiral, as families frequently lose belongings, lose their job, have to move in with family or friends, or move to neighborhoods of higher crime and worse-performing schools.
Unaffordable and unstable housing creates many other challenges as well. Families that devote too much of their income to rent are forced to cut back on food, and may be unable to afford transportation to work, school, or the doctor. Parents in low-income families with unaffordable housing face high rates of depression and often miss medical appointments, while children in such stressful environments often face developmental challenges that make it hard to succeed in school.
The scale of this problem in DC is enormous. Some 26,000 households are both extremely low-income and spending more than half their income on rent. Nearly one of every five children in the District faces such situations.
The good news is that access to affordable housing can help. Extremely low-income residents who gain access to affordable housing are far less likely to be overcrowded or live doubled up with friends or family. With affordable housing, the likelihood of becoming homeless plummets. Families with affordable housing move less frequently, and when they do, it is to lower-poverty neighborhoods, rather than to more disadvantaged ones. Not having to spend the majority of income on rent allows parents to buy enough food to feed their family. Finally, programs that help adults find jobs are more effective if those adults have the steady foundation of an affordable home, and children who grow up in affordable housing earn more as adults.
Despite the strong evidence that affordable housing is critical to the stability and success of extremely low-income families, local housing resources are not well targeted to the households in greatest need. While 77 percent of the DC renters in need of affordable homes are extremely low-income, only 39 percent of affordable apartments the city has supported with public dollars since 2010 are within reach of this population. The rest are targeted to higher-income groups. Consequently, while 26,000 extremely low-income households face severe challenges affording housing, only 2,100 received help in the past six years.
DC’s Extremely Low Income Renters Often Pay Nearly All Their Income for Rent
The shrinking supply of low-cost housing options in the District is squeezing the city’s lowest-income households, forcing most to spend a majority of their income on rent and leaving many financially on the edge. The analysis below uses data from the US Census Bureau’s American Community Survey.[1]
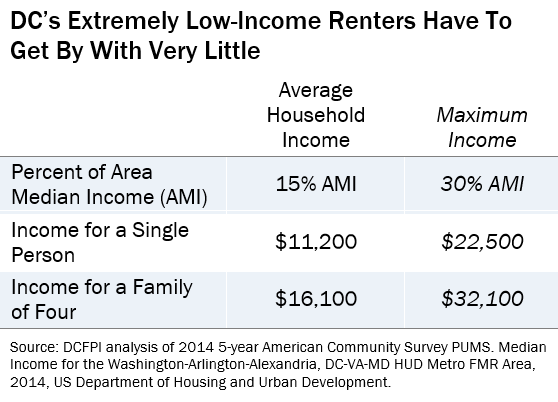
The 43,000 DC renter households considered “extremely low-income” typically have shockingly low incomes. While extremely low-income is defined as income below 30 percent of the area median income, on average, these households have incomes at 15 percent of the area median, or only $16,000 for a family of four (Table 1). The income of extremely low-income households has remained flat over the past decade,[2] reflecting stagnant pay for workers without a college degree,[3] and the large share of seniors and people with disabilities who rely on fixed incomes.
Meanwhile, rising rents have eliminated nearly all low-cost housing options in the private market over the past decade,[4] and thousands of subsidized apartments have been lost because the requirement to stay affordable ran out.[5] As a result, extremely low-income households must put even larger shares of the household budget toward rent.
- Extremely low-income renters usually pay the majority of their income for rent. 62 percent pay more than half of their income for rent and utilities. These 26,000 households are considered “severely housing cost burdened” by the US Department of Housing and Community Development and classified as a “worst case housing need.”[6] Housing hardship among extremely low-income renters has increased since 2004, when half of these households spent a majority of income on rent.[7]
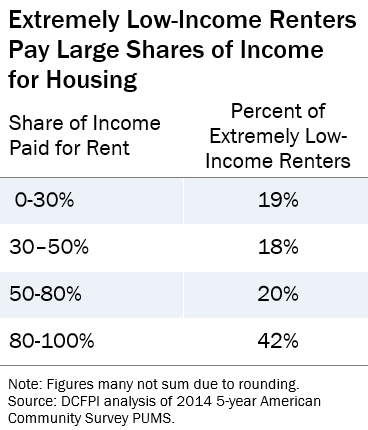
- 42 percent of extremely low-income renters pay 80 percent or more of their income for rent (Table 2). Despite the seeming impossibility of dedicating all or almost all income to rent, many of the poorest residents do have to try to get by with such high housing cost burdens,[8] often living in apartments they cannot afford simply because they have no other option. Households in this situation have little or no money left after making rent each month, and many go through cycles of getting behind on rent and then being evicted or abandoning their apartment to avoid eviction. The share of extremely low-income households in DC paying at least 80 percent of income toward rent has increased since 2004, when one-third had housing costs this high.[9]
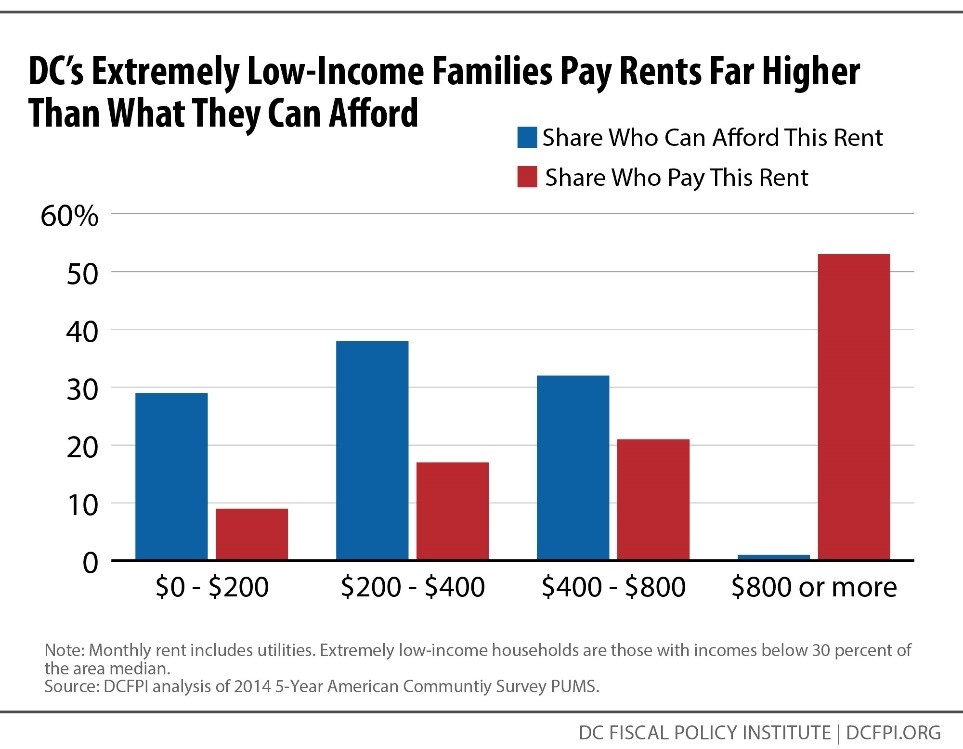
- About one third of extremely low-income renters cannot afford more than $200 a month in rent, yet only 9 percent of extremely low-income renters have housing at that price. And while almost no extremely low-income renters can afford to pay more than $800 a month in rent, a majority do (Figure 1).
Extremely Low-Income Families with Children and People with Disabilities Struggle with High Housing Costs
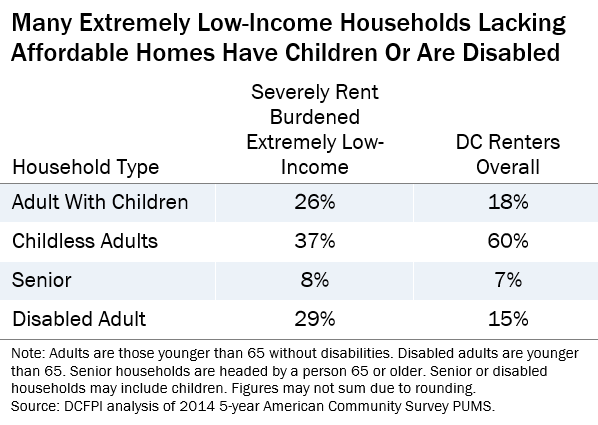
A typical extremely low-income renter in need of affordable housing is a working mother raising two children, a person with a disability relying on a fixed income, or a childless adult in a low-wage job (Table 3). Most are working or looking for work, except for those who are elderly or disabled.
- One-fourth of extremely low-income renters in need of affordable housing are families with children. Three-fourths of these families are headed by a single woman, and they on average have two children.[10] Wages are the main source of income for most of such households.
- Many extremely low-income households without affordable housing have disabilities. Some 30 percent of extremely low-income renters in need of affordable housing are headed by a person with a disability. This reflects the fact that some people with disabilities are unable to work and must rely on low, fixed levels of disability assistance benefits.[11] In DC, Social Security Disability Insurance (DI) provides just $12,300 in annual income on average.[12] Even paying $500 in rent would take up half of the income for a household at this level.
- Many extremely low-income renters in need of affordable housing are childless adults. Some 37 percent of extremely low-income renters without affordable housing are non-elderly, non-disabled adults without children. Three-fourths of these households are single-person households. Two-thirds rely on wages as the main source of income.
- A small share of extremely low-income renters in need of affordable housing are headed by seniors. The share of severely rent burdened extremely low-income households who are seniors is relatively small¾just 8 percent. This could be due to the fact that extremely low-income households headed by seniors are more likely to be homeowners than other types of extremely low-income households.[13] Moreover, many subsidized apartment buildings are reserved for seniors,[14] so extremely low-income seniors may be more likely to have affordable housing.
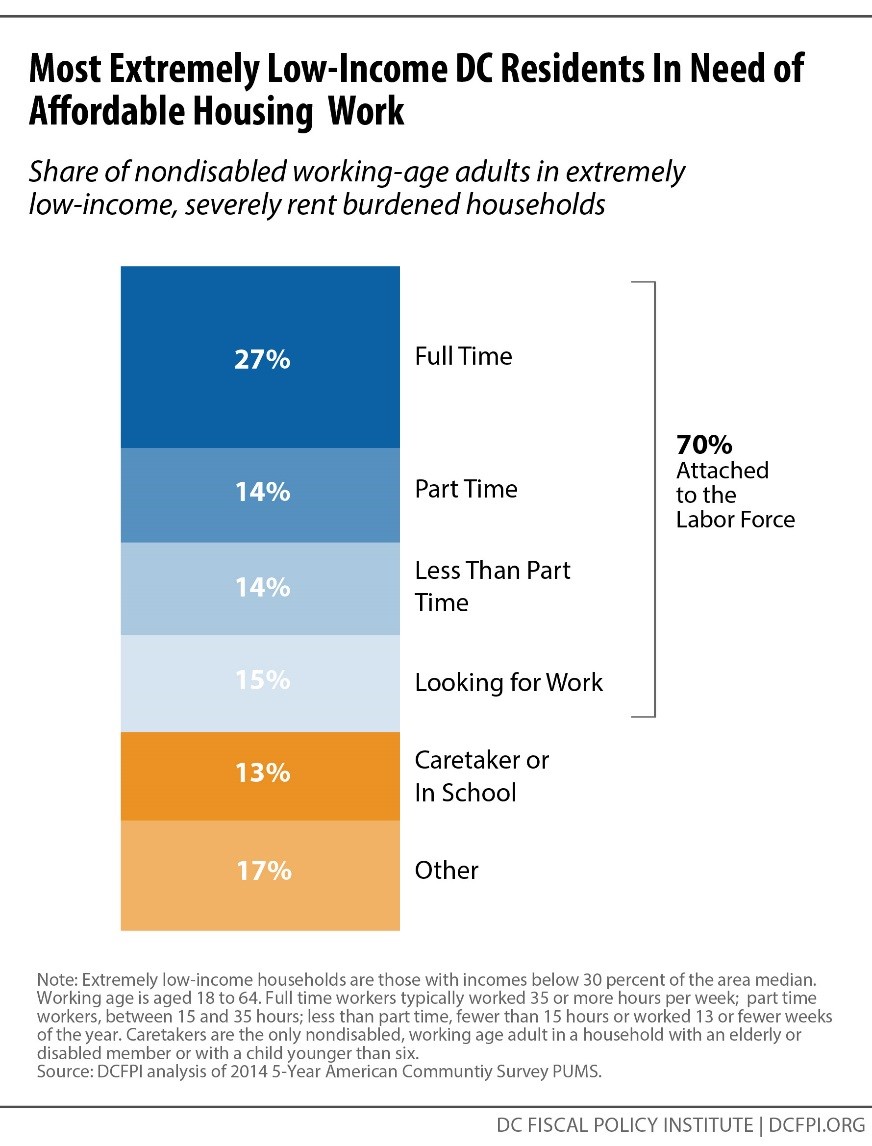
Most Extremely Low Income Renters Are in the Labor Force
Most extremely low-income residents in need of affordable housing are working or looking for work, if they are not elderly or disabled. Many work in the service sector, in retail, food service, or other occupations marked by low wages and only part-time options.
- 70 percent of extremely low-income renters who are severely cost burdened are engaged in the labor force if they are able to work. The large majority of adults without disabilities are employed or looking for work. Many of those who aren’t attached to the labor force are attending school, or are caring for a very young, disabled, or elderly family member (Figure 2).[15]
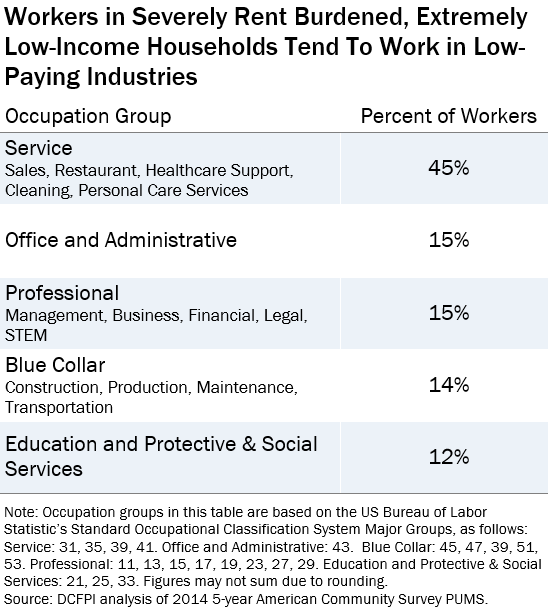
- Workers without affordable housing tend to work in lower-wage occupations with stagnant pay and few career advancement opportunities. Nearly half of extremely low-income workers in need of affordable housing work in the service sector, which includes retail, cleaning, food service, and healthcare support occupations (Table 4). Wages for those jobs are low, and have not risen much while housing costs have grown substantially.[16] Most extremely low-income workers with severe housing problems worked part-time or less,[17] indicating that many have jobs that do not offer full-time hours, or they face barriers to finding full-time work (Figure 2).
- Low levels of education make it hard to move to a better-paying industry. Just 15 percent of people in severely rent burdened, extremely low-income households have a college degree or more. DC’s recent job and wage growth has been concentrated in sectors requiring advanced credentials, making it difficult for those without a college degree to increase their income.[18]
Low Benefits for Many Seniors and People with Disabilities Create Housing Challenges
Many DC households headed by a senior or person with a disability have severe housing cost burdens because they rely on low fixed incomes from disability or Social Security benefits. Social Security provides less than $15,000 in annual income on average to workers who are retired or have a disability in the District. For those with long-term disabilities who do not have the work history needed to receive Social Security disability benefits, Supplemental Security Income provides DC residents just $7,700 annually on average.[19] Rent of just $600 a month would take up half the income of the average Social Security recipient in DC, and 94 percent of the income of an SSI recipient.
These challenges have worsened over the past decade, because rents in DC are rising faster than Social Security or disability benefits. From 2004 to 2014, Social Security and disability benefits did not rise more than inflation.[20] Yet over the same time period, median rent for an apartment in the District rose 35 percent, adjusting for inflation.[21]
The Lack of Affordable Housing Is Linked to Housing Instability and Homelessness
Extremely low-income families paying unaffordable rents often live on the brink of losing their home. Month in and month out, most are spending nearly all of their income on rent, and many are likely to be behind. In this situation, even a modest change in household finances, such as an unexpected expense, a short illness, a job loss, reduction of work hours, or late public benefit check, can lead to being behind on rent or a utility bill payment–and in turn, to being forced to move because of eviction or in anticipation of eviction.
DC families with extremely low incomes who cannot afford a home of their own are at great risk of being evicted and becoming homeless. Many have little choice but to double up with friends or family and live in overcrowded conditions. And extremely low-income families are often forced to move from place to place, which often means losing some of their belongings and moving to a neighborhood with even more challenges than their prior neighborhood. Any of these housing disruptions can lead to a downward spiral, including job loss, repeated moves to worse housing, and homelessness.
- Many DC households experience eviction. Over 7,000 DC households were served eviction notices in 2014 (the most recent year for which data is available).[22] While data on the characteristics of households evicted in DC is not available, it’s likely that many were extremely low-income and struggling to pay the rent without housing assistance. Nationally, one in nine poor renters with severe cost burden could not pay all of their rent at least once in the past year, and one in 11 of such renters expected to be evicted soon.[23] One study found that one of every six moves by poor renters was due to eviction.[24]
- Homelessness in DC is rising as housing challenges grow. Some 1,500 DC families, including 4,700 children and parents, were homeless on a single night in 2016. [25] There are more homeless children and parents in DC than there are homeless single adults for the first time since data collection began 15 years ago. This signals that the growing affordable housing crisis and particular lack of housing for the lowest income residents is changing the nature of homelessness in the city. One in eight poor families with children had lived on the street or in a shelter in just the past year, according to a six-city study. [26] The connection of family homelessness to lack of affordable housing is clear. Families living in unaffordable housing are four times more likely to have recently lived on the street or in a shelter, compared to those with affordable housing.[27]
- Low-income renters are often overcrowded or doubled up. Families who can’t afford a home of their own, or who have lost an apartment due to eviction, often turn to friends and family for a short- or long-term place to stay. “Doubling up” can cause tension and overcrowding, and is not a stable housing situation as one family may be asked to leave,[28] possibly on short notice. A six-city study found that nearly one-third of poor families with children had doubled up with friends or relatives at some point in the year because they had no place of their own, and nearly half had lived in crowded conditions.[29]
- Unaffordable housing leads to frequent moves. Without stable, affordable housing families are often forced to move from place to place, changing homes once or more per year.[30] Poor families who move involuntarily tend to end up in worse housing conditions,[31] and in neighborhoods with higher crime and poverty rates.[32] And they are subsequently more likely to move again within the next year,[33] perhaps in search of better quality housing or safer neighborhoods than they were forced to settle for.
- Frequent moves can disrupt the ability to find and keep employment. Low-wage workers who have had to move involuntarily are more likely to subsequently lose their jobs,[34] perhaps because their ability to perform well at work is damaged by the unexpected need to search for a new home or be present at eviction proceedings.
The Harmful Consequences of Unaffordable and Unstable Housing
Living in severely unaffordable housing poses serious long-term risks to families’ health and well-being. Without a stable, affordable place to live, many extremely low-income families are not able to buy enough food. The stresses of severely unaffordable housing also makes it difficult to maintain good mental and physical health, to find and keep a job, and for kids to focus and learn in school.
Children Lacking Affordable Homes Struggle to Succeed in School
Nearly 19,000 DC children live in severely rent burdened and extremely low-income families–representing 18 percent of all children in the District. These children are at increased risk of developmental and educational challenges.
Children in families without affordable housing have trouble arriving to school ready to learn and succeeding academically. Very young children who move frequently do worse than their peers on measures of behavioral school readiness, such as attention and healthy social behavior.[35] Children in severely rent burdened families or in overcrowded conditions score worse on cognitive achievement tests,[36] perhaps because they are exposed to damaging amounts of household stress,[37] and perhaps because their parents cannot afford enough books or toys or quality childcare.[38] Children who move frequently or live in crowded conditions are more likely than other children to fall behind and drop out of school.[39]
Unaffordable Rents Leave Many Families Unable to Buy Enough Food
Extremely low-income households who are forced to devote a large share of income to housing face painful choices between making rent and buying basic necessities. As food is often a family’s second-largest single expenditure after housing, it is often the first to be cut back on when rent becomes unaffordable.[40] In other words, “the rent eats first.”[41]
There is a direct connection between a lack of affordable housing and food insecurity. Poor families in areas with high housing costs are more likely to be food insecure,[42] and to report worrying frequently about having enough food.[43] Low-income households who are severely housing cost burdened spend $150 less on food per month than their non-cost burdened peers.[44]
Severe Rent Burdens Can Threaten Health
Struggling to make rent is a significant source of stress which harms the health of low-income families. People who are behind on rent are more likely to report being depressed.[45] Worrying frequently about the ability to pay for housing is associated with mental distress and insufficient sleep.[46] Living in unstable, unaffordable housing can contribute to the “toxic stress” many poor families experience, which may lead to lifelong problems by damaging children’s mental and physical health and impairing their development.[47]
Families who have trouble paying the rent or live doubled-up are more likely to delay medical care or filling needed prescriptions.[48] This could reflect the stress these families face, or the lack of money after paying the rent to get to a doctor’s appointment or the pharmacy. Low-income households who are severely cost burdened spend $110 less per month on healthcare than their peers who are not cost burdened.[49]
Relatedly, lack of quality, affordable housing leaves many households living in deteriorated, unhealthy housing, with toxic substances, pests, inadequate ventilation, or unreliable heating. Families living in substandard housing suffer higher rates of chronic illnesses such as asthma, respiratory infections, and lead poisoning.[50]
Affordable Housing Provides a Strong Foundation for Family Stability and Success
The impact of affordable housing problems on so many aspects of the lives of low-income households suggests that investments in affordable housing can provide a stable foundation for families and their children and reduce the need for other, more intensive interventions, such as homeless services, healthcare, special education, and child welfare involvement. An experimental study[51] of poor families with children found that, compared to the control group, families who gained access to affordable housing through a voucher gained stability and were better able to meet basic needs.
- Affordable housing reduces harmful over-crowding. Low-income families with children who gained access to affordable housing were two-thirds less likely than severely rent burdened families to live doubled-up with friends or relatives. And gaining affordable housing cut the likelihood of living in crowded conditions in half.
- Affordable housing reduces homelessness. Poor families who gained affordable housing through a housing voucher were three-fourths less likely than other poor families to experience homelessness. This effect was even stronger for young parents (aged 24 or younger) with children. In other words, families without affordable housing were four times more likely to have lived on the street or in a shelter than their peers who were able to obtain an affordable place to live.
- Affordable housing reduces the likelihood of frequent moves. Poor families who gain access to affordable housing moved far less frequently than families without affordable housing. And when families with a housing subsidy move, they tend to move to neighborhoods of lower poverty and crime. In contrast, when poor families without affordable housing are forced to move, they typically end up in neighborhoods with higher poverty and crime.
- Affordable housing allows families to eat better. Families with a housing voucher spent 60 percent more on food than those who didn’t get housing assistance.
- Affordable housing may boost the effect of programs that help adults get a job. Programs that help adults find jobs tend to be more effective for families who also receive housing assistance.[52]
- Affordable housing helps youth earn more as adults and avoid incarceration. For teens, each year spent living in subsidized housing is associated with an adulthood earnings boost of 3 to 5 percent. It also may reduce the likelihood of incarceration.[53]
DC’s Substantial Investment in Affordable Housing Is Not Adequately Reaching Residents Most in Need
The District’s recent investments in affordable housing, while substantial, have not been well matched to meet the housing needs of extremely low-income renters. While extremely low-income renters represent 77 percent of the DC households in need of affordable homes, only 39 percent of new affordable apartments created with public dollars since 2010 was within reach of these families. The rest were targeted to higher-income groups. And in recent years, the District only modestly expanded its tenant-based rental assistance program, the housing tool particularly suited to help extremely low-income families.
Since 2010, the District financed (or committed to finance) 10,040 affordable rental units, through building new housing, preserving existing housing, or by providing tenant-based vouchers. Of those 10,040 rental units, 3,880—two in five—were for extremely low-income renters (Figure 3):
- New construction. The District provided subsidies to build 4,120 new affordable rental units. Only 880 of those units (one in five) were affordable to extremely low-income households.[54]
- Preservation. The District also provided subsidies to acquire, rehabilitate, and preserve 4,700 rental units, of which 1,770 (38 percent) served extremely low-income residents.
- Rental assistance for tenants. The District created 1,220 new vouchers to help households pay the rent at private-market apartments.[55] All were for extremely low-income residents.
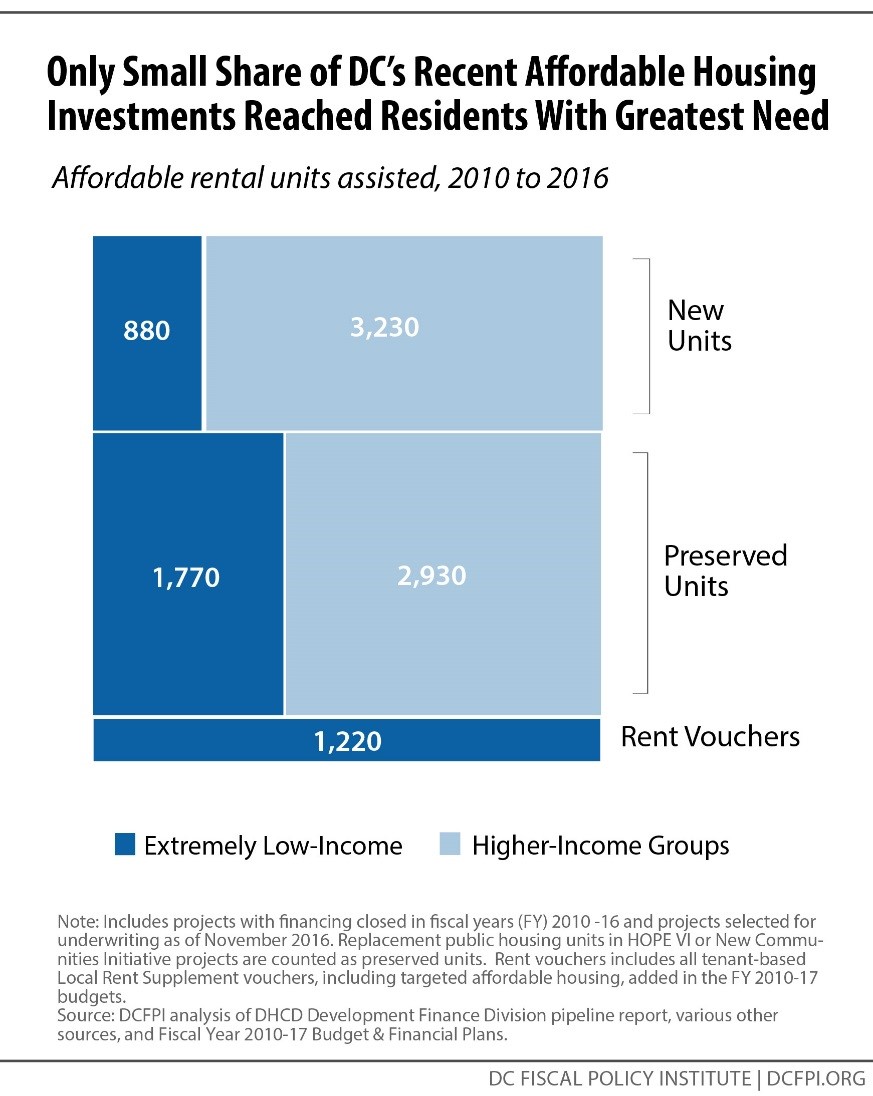
In all, between 2010 and 2016, the city’s programs that produce new affordable housing—construction and vouchers—provided new housing assistance to just 2,100 extremely low-income families. The city’s preservation efforts kept fewer than 2,000 existing extremely low-income units affordable. This means that the District has not made much progress to serve the 26,000 extremely low-income households with severe rent burdens. It also means that the majority of the city’s affordable housing dollars have gone to higher-income groups, despite the fact that extremely low-income renters face the most severe housing challenges.
These outcomes reflect the nature of programs that produce or renovate affordable housing, which have been the main focus of DC’s affordable housing investment in recent years. While tenant vouchers serve extremely low-income residents, programs to build or preserve affordable housing don’t necessarily target only the lowest-income renters.
- Affordable housing production programs serve both renters and homeowners: In addition to the 8,820 rental units assisted with public dollars between 2010 and 2016, the District also supported the creation or preservation of 740 homeownership or cooperative units. Expanding homeownership opportunities is an important component of the city’s affordable housing strategy.
- A substantial share of affordable housing production resources go to preserve existing housing. About half of the 8,820 rental units assisted¾4,120—are newly built, and the rest are existing units that were being preserved through rehabilitation and repairs, or through tenants exercising their opportunity to purchase rights.[56] Investments in existing affordable housing that needs renovation helps low-income residents stay in their homes, and often is less expensive than building new affordable housing from scratch.
- Affordable housing production programs serve households at a range of incomes. For example, housing developed with federal low-income housing tax credits tend to be focused on families with incomes at 60 percent of area median income, or $64,000 for a family of four. Programs serve a variety of income levels because DC residents throughout the lower half of the income ladder face affordable housing challenges, though those at the bottom face the most severe problems. By law, at least 40 percent of the Housing Production Trust Fund resources must go to serve extremely low-income households, and the remainder are available to serve somewhat higher income households. As a result, only 880 of the 4,120 newly built rental units are affordable to extremely low-income renters.
- To reach the lowest-income households, rental assistance is often needed, in addition to up-front financing help. Affordable housing production programs, such as the Housing Production Trust Fund, often cannot on their own bring rents down to levels affordable to extremely low-income renters, because they assist with only the up-front costs to build or renovate housing. Rental assistance helps meet the ongoing costs of operating housing, such as utilities and maintenance. Four out of five recently produced subsidized apartments affordable to extremely low-income households were paired with rental assistance from the Local Rent Supplement Program (LRSP) or a federal rental assistance program. Without LRSP, they likely would not have been affordable to extremely low-income households. Yet DC has added new LRSP funds only sporadically in recent years, making it hard for production programs like the Housing Production Trust Fund to reach extremely low-income renters.
These findings suggest that meeting the housing needs of the District’s poorest households will require supplementing the substantial investment in affordable housing production. In particular, the District will need to expand its programs that provide ongoing rental assistance to extremely low-income families.
Recommendations
Increase Funding and Share of Funding Directed to Extremely Low-Income Renters
Going forward, a greater share of the District’s housing production should be directed toward meeting the enormous and urgent housing needs of extremely low-income renters. And the District should take steps to enhance the ability of local and federal housing subsidies to reach the lowest-income residents.
- Meet and consider exceeding the requirement that 40 percent of the Housing Production Trust Fund serve extremely low-income households.
The Housing Production Trust Fund, the city’s largest affordable housing tool,[57] is required by law to direct at least 40 percent of its funds to housing for extremely low-income residents. In recent years the District has had trouble meeting this target. Over fiscal years 2014 and 2015 combined, just 24 percent of Trust Fund dollars went to fund extremely low-income housing. While it appears that the Trust Fund is on track to meet the 40 percent target in fiscal year 2016, the District should remain vigilant that the city’s recent record-high investment in the Trust Fund are substantially assisting the population with the greatest need. In addition, the city should consider directing more than 40 percent of Trust Fund resources to extremely low-income residents. The law permits the city to spend a greater share of the Trust Fund on housing for extremely low-income residents, as long as the share going to housing for residents between 30 to 50 percent of the median income does not drop below 40 percent. This means the city has the flexibility to spend up to 60 percent of the Trust Fund on extremely low-income housing.
- Boost rental assistance through the Local Rent Supplement Program.
Fully 80 percent of rental units affordable to extremely low-income households produced in recent years receive ongoing assistance from the Local Rent Supplement Program (LRSP) or a federal rental assistance program.[58] Without rental assistance, extremely low-income units will rarely be produced. LRSP is key to ensuring that the Trust Fund is able to serve extremely low-income households, because it helps pay the ongoing operating and maintenance costs that one-time financing assistance from the Trust Fund does not cover. LRSP provides operating cost assistance to projects assisted by the Housing Production Trust Fund.[59] It also provides monthly tenant-based subsidies to help extremely low-income households pay the rent at private-market apartments.
- Use the National Housing Trust Fund, a federal block grant, to fund rental assistance.
Starting in fiscal year 2017, the District will receive approximately $3 million per year from the newest federal block grant, the National Housing Trust Fund (NHTF). The NHTF must be entirely directed to housing for extremely low-income households—and unlike other block grants or the Housing Production Trust Fund, it can be used to fund operating assistance.[60] Given that the availability of operating assistance is critical to ensuring affordable housing projects can reach extremely low-income families, the District should prioritize the NHTF for this purpose.
Preserve Existing Subsidized Housing Affordable to Extremely Low-Income Renters
Holding on to the remaining sources of affordable housing for extremely low-income renters is just as critical as creating new housing. To prevent more low-cost housing from being lost, the city should implement a comprehensive housing preservation strategy. In addition, public housing residents should be protected from displacement due to redevelopment.
- Follow through on the recommendations of the Housing Preservation Strike Force.
Most rental housing assisted with local or federal subsidies is required to stay affordable for a set number of years (for instance, 40 years for the Housing Production Trust Fund), after which building owners can choose to shift to market rate rents or convert to condominiums, or they can choose to renew the subsidy or enter a new subsidy program. Over the past decade, 2,280 affordable units were lost due to subsidy expiration. Most received rental subsidies through the federal Section 8 program, which overwhelmingly serves extremely low-income renters.[61] An additional 13,000 affordable units will have their subsidies expire by 2020, putting some at risk of market-rate conversion.[62]
A “strike force” appointed by Mayor Bowser recently formulated a comprehensive strategy to preserve at-risk, subsidized affordable housing. First, the city should create a public-private housing preservation fund, composed of “seed funding” from the DC government, and private and philanthropic investments. The fund would help developers or tenants buy properties that they will renovate and preserve as affordable. Second, the strike force recommended utilizing the District’s opportunity to purchase affordable buildings when they come up for sale, including those with expiring subsidies. This tool, known as DOPA, has been in place since 2009 but never used. Third, the city should create a designated preservation unit within the Department of Housing and Community Development tasked with tracking at-risk affordable buildings, and reaching out to owners to discuss options to keep the building affordable.
Together, these three components of the strike force’s plan have the potential to stem the loss of DC’s remaining housing affordable to extremely low-income renters. The city should implement the recommendations immediately, including by designating funding for the public-private preservation fund and to exercise the District’s opportunity to purchase.
- Ensure no family loses housing assistance when redeveloping public housing.
The city’s public housing stock serves over 7,300 extremely low-income households, mostly families with children, seniors, and people with disabilities.[63] Most public housing properties are in poor condition because of a lack of federal resources, and have been slated for redevelopment by the DC Housing Authority or the New Communities Initiative, a partnership with DC government. While public housing residents need better quality housing, redevelopment can carry risks that residents will be unable to return to the new housing and will be displaced from their community. This can happen when households must pass re-screening criteria in order to return to the property after construction,[64] or if there is no longer an appropriately sized unit for them at the property.[65] In the worst case, households may lose their housing assistance altogether, because they were deemed ineligible or were unable to successfully use a voucher.[66]
To avoid displacing extremely low-income residents, the District should avoid imposing additional screening criteria on public housing residents during redevelopment, and should replace each torn-down unit with one of equivalent size. In addition, redeveloping properties in phases, rather than all at once, or building some units nearby first before demolishing the property, will minimize disruption to residents.
- Require city-funded affordable housing to stay affordable permanently.
Affordable housing built with public dollars usually comes with an expiration date—the housing must remain affordable but only for a set number of years. For instance, rental units assisted by the Housing Production Trust Fund must remain affordable for 40 years. After that, the building owner is free to charge market-rate rents, or convert the building to condominiums. When that happens, entire buildings of low-cost apartments can be lost and low-income renters are displaced. It is expensive and often impossible for the city to rebuild the lost housing. The District can avoid this cycle by requiring buildings assisted with housing subsidies to stay affordable permanently. The city of Boston, Massachusetts adopted this policy a decade ago, after seeing too much of its subsidized housing evaporate.[67] A permanent affordability policy will help the District get the most out of its investments in housing for extremely low-income renters, by ensuring the units it funds will also be there for future generations.
Endnotes
[1] This analysis largely excludes people experiencing homelessness, and it deliberately excludes college-student households, and households with zero or negative income:
Homeless residents are not included. The data source for this analysis, the American Community Survey (ACS) includes two types of observations housing units, and people living “group quarters” such as homeless shelters, nursing facilities, correctional facilities, and college dormitories. This analysis excludes observations in group quarters due to the unreliability of those estimates for DC due to small sample size, so homeless residents living in shelters or other short-term, group housing situations are excluded. Unsheltered homeless individuals are not surveyed by the ACS, which surveys only fixed addresses, so this analysis excludes people who are living on the street. This analysis does capture “doubled up” households; they are counted as part of the household they are staying with, because the ACS includes all people “living or staying” in the housing unit as part of the household—even if they are living there temporarily, if they do not have another place to stay.
College student households are excluded. This is because of the likelihood that such households may appear severely rent burdened because their rent is paid by a family member outside the household, and because such households are unlikely to have a sustained, long-term need for subsidized housing, so are not comparable to other extremely low-income households. These households are defined as those headed by college or graduate student aged 35 or younger, without children, who within the past year worked fewer than 35 hours in a typical week, or worked fewer than 13 weeks. Approximately 9 percent of extremely low-income (ELI) households who are severely rent burdened meet this definition of college student households. Demographically, these college student heads of household are markedly different from the rest of the ELI, severely rent burdened population. They tend to be white (81 percent), live west of the Anacostia River (92 percent), were born outside the District (95 percent). By contrast, other ELI heads of household with housing problems are mostly black (84 percent), 59 percent are located west of the river, and nearly half (48 percent) were born in DC.
Households reporting zero or negative income are excluded. This is due to the difficulty of determining whether such households appear extremely low-income due to temporary business or accounting losses, or truly have no income. For instance, a household whose income is entirely composed of capital gains would appear to have zero income in the ACS, because the ACS does not ask about capital gains income.
[2] Adjusting for inflation, the average incomes of extremely low-income households were statistically unchanged from 2004 to 2014. Over the same time period, the District’s overall average income rose by a third. DCFPI analysis of American Community Survey 1-year PUMS. While the majority of the analysis in this paper uses the 2014 5-year ACS PUMS—which represents a five-year average—in order to have a sample size large enough to obtain statistically robust detailed breakdowns, this section uses one-year ACS PUMS instead in order to compare two discreet years.
[3] Boivie, I. (2015). Two Paths to Better Jobs for DC Residents: Improved Training and Stronger Job Protections. Washington, DC: DC Fiscal Policy Institute. Retrieved from http://www.dcfpi.org/wp-content/uploads/2015/10/State-of-Working-DC-Final-10.14.15.pdf
[4] Rivers, W. (2015). Going, Going, Gone: DC’s Vanishing Affordable Housing. Washington, DC: DC Fiscal Policy Institute. Retrieved from http://www.dcfpi.org/wp-content/uploads/2015/03/Going-Going-Gone-Rent-Burden-Final-3-6-15format-v2-3-10-15.pdf
[5] According to DCFPI analysis of the DC Preservation Catalogue, 18 subsidized rental properties containing 2,280 affordable units were lost between 2004 and 2014 due to subsidy expiration. Most were properties with federal project-based rental assistance (Section 8), which is most likely to serve extremely low-income renters.
NeighborhoodInfo DC. (2016). DC Preservation Catalogue. Washington, DC: Urban Institute and Coalition for Nonprofit Housing and Community Development. Retrieved from http://dcpres.urban.org/DCP/
See also:
Tatian, P., Leopold, J., Oo, E., Joseph, G., MacDonald, G., Nichols, A., . . . Zhang, S. (2015). Affordable Housing Needs Assessment for the District of Columbia, Phase II. Washington, DC: Urban Institute. Retrieved from http://www.urban.org/sites/default/files/alfresco/publication-pdfs/2000214-Affordable-Housing-Needs-Assessment-for-the-District-of-Columbia.pdf
[6] Steffen, B. L., Carter, G. R., Martin, M., Pelletiere, D., Vandenbroucke, D. A., & Yao, Y.-G. D. (2015). Worst Case Housing Needs: 2015 Report to Congress. Washington, DC: US Department of Housing and Urban Development. Retrieved from https://www.huduser.gov/portal//Publications/pdf/WorstCaseNeeds_2015.pdf
[7] DCFPI analysis of 2004 and 2014 1-year American Community Survey PUMS. While the majority of the analysis in this paper uses the 2014 5-year ACS PUMS—which represents a five-year average—in order to have a sample size large enough to obtain statistically robust detailed breakdowns, this section uses one-year ACS PUMS instead in order to compare two discreet years.
[8] Sociologists and journalists have encountered many poor families who have no choice but survive on little or no income after paying rent. Examples below.
DeParle, J., & Gebeloff, R. M. (2010, January 2). Living on Nothing but Food Stamps. The New York Times. Retrieved from http://www.nytimes.com/2010/01/03/us/03foodstamps.html
Desmond, M. (2016). Evicted: Poverty and Profit in the American City. New York: Crown Publishers.
Edin, K. J., & Shaeffer, H. L. (2015). $2.00 A Day: Living on Almost Nothing in America. Boston: Houghton Mifflin Harcourt.
It is also possible that some observations of 100 percent rent burden in the American Community Survey may be due to temporary drops in income, those living off savings or in-kind support, and those who are behind on rent; or that some observations may be a result of reporting error (for instance, households with rental assistance reporting the total rent for their unit, rather than the share of the rent they pay, with the rest paid by the subsidy). However, even assuming an error rate of 50 percent, the share of ELI households paying between 80 and 100 percent of income remains an astonishingly high 21 percent. See:
Eggers, F. J., & Moumen, F. (2010). Investigating Very High Rent Burdens Among Renters in the American Housing Survey. US Department of Housing and Urban Development. Retrieved from https://www.huduser.gov/portal//Publications/pdf/2010_high_rent_burdens_v2.pdf
While Eggers and Moumen focus on the American Housing Survey, some of their findings are relevant to the American Community Survey, which finds similar rates of 100 percent rent burden.
[9] DCFPI analysis of 2004 and 2014 1-year American Community Survey PUMS. While the majority of the analysis in this paper uses the 2014 5-year ACS PUMS—which represents a five-year average—in order to have a sample size large enough to obtain statistically robust detailed breakdowns, this section uses one-year ACS PUMS instead in order to compare two discreet years.
[10] Single is defined as having no spouse or unmarried partner in the household. In these households, the average number of children per household is two, and 74 percent of these households include a child younger than 6.
[11] Fremstad, S. (2009). Half in Ten: Why Taking Disability into Account is Essential to Reducing Income Poverty and Expanding Economic Inclusion. Washington, DC: Center for Economic and Policy Research. Retrieved from http://cepr.net/documents/publications/poverty-disability-2009-09.pdf
[12] Average Social Security benefit level for disabled workers in DC. Social Security provides old age and disability benefits for those who are “insured” based on their work history and Social Security tax contributions. Another program that provides income to people with disabilities is Supplemental Security Income (SSI), which pays benefits based on financial need, typically to those with long-term disabilities, and is separate from Social Security. On average, SSI recipients in the District with disabilities receive $7,700 per year. One-fourth of SSI recipients in DC also receive Social Security benefits.
US Social Security Administration. (2016). OASDI Beneficiaries by State and County, 2016. Retrieved from https://www.ssa.gov/policy/docs/statcomps/oasdi_sc/2015/index.html
US Social Security Administration. (2016). SSI Recipients by State and County, 2016. Retrieved from https://www.ssa.gov/policy/docs/statcomps/ssi_sc/2015/index.html
[13] 57 percent of extremely low-income households headed by a senior are homeowners, compared to just 18 percent of extremely low-income households overall.
[14] For instance, 14 of DC’s 40 public housing properties are dedicated to housing seniors and/or people with disabilities, according to the DC Housing Authority.
[15] Potential workers who are likely caring for a household member are defined as those who are the only nondisabled adult in a household that includes one or more of the following members: child younger than 6, a senior, or an adult with disabilities.
[16] Median wages in the service sector actually declined somewhat in real terms between 2004 and 2014. Adjusting for inflation, the median wage for service workers in the District (defined as those in the US Bureau of Labor Statistic’s Standard Occupational Classification System Major Groups 31, 35, 39, and 41) fell from $13.70 in 2004 to $12.00 in 2014. Over the same period, median rent in the District rose 35 percent.
DCFPI analysis of American Community Survey 1-year PUMS.
US Bureau of Labor Statistics. (2014). Occupational Employment Statistics By State. Retrieved from http://www.bls.gov/oes/tables.htm
[17] Full time workers are defined as those who typically worked at least 35 hours per week in the last year; part-time workers worked between 15 and 35 hours; and less than part-time workers worked fewer than 15 hours, or worked fewer than 13 weeks out of the year.
[18] Boivie, I. (2015). Two Paths to Better Jobs for DC Residents: Improved Training and Stronger Job Protections. Washington, DC: DC Fiscal Policy Institute. Retrieved from http://www.dcfpi.org/wp-content/uploads/2015/10/State-of-Working-DC-Final-10.14.15.pdf
[19] One-fourth of Supplemental Security Income recipients also receive some type of Social Security benefit. See note 12.
US Social Security Administration. (2016). OASDI Beneficiaries by State and County, 2016. Retrieved from https://www.ssa.gov/policy/docs/statcomps/oasdi_sc/2015/index.html
US Social Security Administration. (2016). SSI Recipients by State and County, 2016. Retrieved from https://www.ssa.gov/policy/docs/statcomps/ssi_sc/2015/index.html
[20] The cumulative effect of cost of living adjustments to OASDI benefits between 2004 and 2014 was a 27 percent nominal increase. Inflation over the same period, according to the CPI-U, was 26 percent, meaning that in real terms, OASDI benefits remained essentially the same.
US Bureau of Labor Statistics (2016). Consumer Price Index for All Urban Consumers, Seasonally Adjusted. Retrieved from http://data.bls.gov/timeseries/CUSR0000SA0
US Social Security Administration (2016). Automatic Cost-Of-Living Adjustments Received Since 1975. Retrieved from https://www.ssa.gov/news/cola/.
[21] In 2004, the median rent paid by District residents was $1,000 (adjusted for inflation to equal 2014 dollars). In 2014, median rent was $1,350, according to American Community Survey 1-Year PUMS.
[22] DC Office of the Tenant Advocate. (2016). Fiscal Year 2015 Annual Report. Retrieved from http://ota.dc.gov/sites/default/files/dc/sites/ota/publication/attachments/Annual%20Report%202015_FOR_WEBSITE_NM.pdf
The reason for these evictions (i.e. rent delinquency, lease violations, nuisance) has not been tabulated. Of the 7,000 households who were served eviction notices, 2,000 were formally evicted. It is likely that a similar share were informally evicted – where the tenant agrees to or is pressured by the landlord to leave, rather than go through the eviction process, which is often expensive and time-consuming, and would blemish their rental history. In the most extensive study of eviction among urban renters, the Milwaukee Area Renters Study, twice as many households were informally evicted (44 percent of all who reported an involuntary move in the past year) than were formally evicted (26 percent). Desmond, M., Gershenson, C., & Kiviat, B. (2015). Forced Relocation and Residential Instability among Urban Renters. Social Service Review. Retrieved from http://scholar.harvard.edu/files/mdesmond/files/desmond.etal_.2015.forcedrelation.ssr_2.pdf
[23] American Housing Survey. (2013). National Summary Table S-08-RO. US Census Bureau. Retrieved from http://www.census.gov/programs-surveys/ahs/data/2013/ahs-2013-summary-tables/national-summary-report-and-tables—ahs-2013.html
[24] Here, eviction includes both formal (court-ordered) and informal evictions. Informal evictions occur when the tenant agrees to or is pressured by the landlord to leave, rather than go through the legal eviction process, which is often expensive and time-consuming, and would blemish their rental history. In the Milwaukee Area Renters Study (MARS), informal evictions were nearly twice as common as formal evictions. The total number of recent moves in the sample was 710. Of those, 47 were formal evictions, 78 were informal evictions, and 4 were moves in anticipation of an eviction, putting the proportion of eviction-related moves to total moves at 18 percent. (The MARS sample median income was $30,400.)
Desmond, M., Gershenson, C., & Kiviat, B. (2015). Forced Relocation and Residential Instability among Urban Renters. Social Service Review. Retrieved from http://scholar.harvard.edu/files/mdesmond/files/desmond.etal_.2015.forcedrelation.ssr_2.pdf
[25] The annual Point-In-Time Survey is a snapshot of sheltered and unsheltered homeless residents on a single night.
The Community Partnership for the Prevention of Homelessness. (2016). Fact Sheet: The 2016 Point in Time Survey. Retrieved from http://www.community-partnership.org/facts-and-figures
[26] The Housing Voucher Evaluation study was conducted from a sample of 8,700 families receiving or eligible for Temporary Assistance for Needy Families in six cities: Atlanta, Houston, Los Angeles, Spokane, Washington, and Fresno, California.
Gubits, D., Khadduri, J., & Turnham, J. (2009). Housing Patterns of Low Income Families With Children: Further Analysis of Data From the Study of the Effects of Housing Vouchers on Welfare Families. Joint Center for Housing Studies of Harvard University. Retrieved from http://jchs.harvard.edu/research/publications/housing-patterns-low-income-families-children-further-analysis-data-study
Mills, G., Gubits, D., Orr, Larry., Leong, D., Feins, J., Kaul, B. Wood, M. (2006). Effects of Housing Vouchers on Welfare Families. US Department of Housing and Urban Development, Office of Policy Development and Research. Retrieved from https://www.huduser.gov/publications/pdf/hsgvouchers_1_2011.pdf
Wood, M., Turnham, J., & Mills, G. for Abt Associates. (2008). Housing Affordability and Family Well-Being: Results from the Housing Voucher Evaluation. Housing Policy Debate, 19(2), 367-412. Retrieved from http://www.abtassociates.com/reports/Woods_Turnham_Mills_%5B11%5D_HPD.pdf
[27] Ibid.
[28] For the reason and destination of people who moved out of a “doubled-up” household, see:
US Department of Housing and Urban Development. (2015). The 2014 Annual Homeless Assessment Report: Additional Forms of Homelessness and Housing Instability. Retrieved from https://www.hudexchange.info/onecpd/assets/File/2014-AHAR-Part-2-Additional-Forms-of-Homelessness-and-Housing-Instability.pdf
[29] The Housing Voucher Evaluation.
Gubits, D., Khadduri, J., & Turnham, J. (2009). Housing Patterns of Low Income Families With Children: Further Analysis of Data From the Study of the Effects of Housing Vouchers on Welfare Families. Joint Center for Housing Studies of Harvard University. Retrieved from http://jchs.harvard.edu/research/publications/housing-patterns-low-income-families-children-further-analysis-data-study
Mills, G., Gubits, D., Orr, Larry., Leong, D., Feins, J., Kaul, B. Wood, M. (2006). Effects of Housing Vouchers on Welfare Families. US Department of Housing and Urban Development, Office of Policy Development and Research. Retrieved from https://www.huduser.gov/publications/pdf/hsgvouchers_1_2011.pdf
Wood, M., Turnham, J., & Mills, G. for Abt Associates. (2008). Housing Affordability and Family Well-Being: Results from the Housing Voucher Evaluation. Housing Policy Debate, 19(2), 367-412. Retrieved from http://www.abtassociates.com/reports/Woods_Turnham_Mills_%5B11%5D_HPD.pdf
[30] In the Milwaukee Area Renters Study (see note 22), 17 percent of renters in the lowest income quartile (below $12,200) had moved two or more times in the previous two years, and 25 percent had moved once. In the Housing Voucher Evaluation Study (see note 51), on average, unassisted families moved 2.3 times over the five-year study period. In the Making Connections study (see note 33), more than half of families with children had moved in the three-year study period.
Desmond, M., Gershenson, C., & Kiviat, B. (2015). Forced Relocation and Residential Instability among Urban Renters. Social Service Review. Retrieved from
http://scholar.harvard.edu/files/mdesmond/files/desmond.etal_.2015.forcedrelation.ssr_2.pdf
Kutty, N. K. (2008). Using the Making Connections Survey Data to Analyze Housing Mobility and Child Outcomes among Low-Income Families. Center for Housing Policy. Retrieved from http://centerforhousingpolicy.org/media/files/Kutty_analysis_for_child_mobility.pdf
Wood, M., Turnham, J., & Mills, G. for Abt Associates. (2008). Housing Affordability and Family Well-Being: Results from the Housing Voucher Evaluation. Housing Policy Debate, 19(2), 367-412. Retrieved from http://www.abtassociates.com/reports/Woods_Turnham_Mills_%5B11%5D_HPD.pdf
[31] Desmond, M., Gershenson, C., & Kiviat, B. (2015). Forced Relocation and Residential Instability among Urban Renters. Social Service Review. Retrieved from http://scholar.harvard.edu/files/mdesmond/files/desmond.etal_.2015.forcedrelation.ssr_2.pdf
[32] Desmond, M., & Shollenberger, T. (2015). Forced Displacement From Rental Housing: Prevalence and Neighborhood Consequences. Demography, 52, 1751–1772. Retrieved from http://scholar.harvard.edu/files/mdesmond/files/desmondshollenberger.demography.2015.pdf
[33] Desmond, M., Gershenson, C., & Kiviat, B. (2015). Forced Relocation and Residential Instability among Urban Renters. Social Service Review. Retrieved from http://scholar.harvard.edu/files/mdesmond/files/desmond.etal_.2015.forcedrelation.ssr_2.pdf
Kutty, N. K. (2008). Using the Making Connections Survey Data to Analyze Housing Mobility and Child Outcomes among Low-Income Families. Center for Housing Policy. Retrieved from http://centerforhousingpolicy.org/media/files/Kutty_analysis_for_child_mobility.pdf
The Making Connections Survey, commissioned by the Annie E. Casey Foundation and NORC at the University of Chicago, followed families in neighborhoods in ten cities (Denver, Des Moines, Hartford, Indianapolis, Louisville, Milwaukee, Oakland, Providence, San Antonio, and Seattle) across two waves separated by three years, 2002-2004 and 2005-2007.
[34] In this study, involuntary moves include moves due to eviction, landlord foreclosure, or housing condemnation. Most involuntary moves in the sample were due to formal (27 percent) or informal (44 percent) eviction.
Desmond, M., & Gershenson, C. (2016). Housing and Employment Insecurity among the Working Poor. Social Problems, 63, 46-67. Retrieved from http://scholar.harvard.edu/files/mdesmond/files/desmondgershenson.socprob.2016.pdf
[35] Ziol-Guest, K. M., & McKenna, C. (2013). Early Childhood Housing Instability and School Readiness: Evidence from the Fragile Families and Child Wellbeing Study. Child Development, 85(1), 103-113. Retrieved from http://crcw.princeton.edu/workingpapers/WP09-21-FF.pdf
[36] Newman, S. J., & Holupka, S. (2015). Housing Affordability and Child Well-Being. Housing Policy Debate, 25(1), 116-151. Retrieved from http://www.tandfonline.com/doi/abs/10.1080/10511482.2014.899261
Solari, C. D., & Mare, R. D. (2012). Housing Crowding Effects on Children’s Wellbeing. Social Science Research, 41(2), 464-476. Retrieved from http://www.ncbi.nlm.nih.gov/pmc/articles/PMC3805127
[37] For a summary of how toxic stress affects children’s development, see:
Coventry, K. (2016). When Every Dollar Counts: Child Poverty Has Lasting Negative Effects, But Even Small Income Boosts Can Help. Washington, DC: DC Fiscal Policy Institute. Retrieved from http://www.dcfpi.org/wp-content/uploads/2016/02/When-Every-Dollar-Counts-Child-Poverty-Income-and-TANF-final.pdf
[38] Newman, S. J., & Holupka, S. (2014). Housing Affordability and Investments in Children. Journal of Housing Economics, 24, 89-100. Retrieved from http://nlihc.org/sites/default/files/Housing_Affordablity_Investments_Children.pdf
[39] Reynolds, A. J., Chen, C.-C., & Herbers, J. E. (2009). School Mobility and Educational Success: A Research Synthesis and Evidence on Prevention. Workshop on the Impact of Mobility and Change on the Lives of Young Children, Schools, and Neighborhoods. Retrieved from http://www.nationalacademies.org/hmd/~/media/Files/Activity%20Files/Children/ChildMobility/Reynolds%20Chen%20and%20Herbers.pdf?_sm_au_=iVVkQs31fT7vTNF3
Conley, D. (2001). A Room With a View or a Room of One’s Own? Housing and Social Stratification. Sociological Forum, 16(2), 263-280. Retrieved from http://citeseerx.ist.psu.edu/viewdoc/download?doi=10.1.1.600.5906&rep=rep1&type=pdf
[40] While the majority of extremely low-income households in DC receive SNAP (food stamp) benefits, SNAP benefits are modest, $1.41 per person per meal. SNAP benefits alone are not always enough to fully cover families’ nutritional needs. One-third of SNAP recipients have visited a food pantry.
Center on Budget and Policy Priorities. (2016). Chart Book: SNAP Helps Struggling Families Put Food on the Table. Retrieved from http://www.cbpp.org/sites/default/files/atoms/files/3-13-12fa-chartbook.pdf
Coleman-Jensen, A., Rabbitt, M. P., Gregory, C., & Singh, A. (2015). Statistical Supplement to Household Food Security in the United States in 2014. Washington, DC: US Department of Agriculture. Retrieved from http://www.ers.usda.gov/media/1896824/ap069.pdf
[41] Matthew Desmond, author of Evicted: Poverty and Profit in the American City (2016).
[42] Fletcher, J. M., Andreyeva, T., & Busch, S. H. (2009). Assessing the Effect of Increasing Housing Costs on Food Insecurity. Social Science Research Network, SSRN Scholarly Paper. Retrieved from http://papers.ssrn.com/sol3/papers.cfm?abstract_id=1503043
[43] Harkness, J., & Newman, S. J. (2005). Housing Affordability and Children’s Well-Being: Evidence from the National Survey of America’s Families. Housing Policy Debate, 16(2), 223-256. Retrieved from http://content.knowledgeplex.org/kp2/img/cache/documents/143497.pdf
[44] Here, low-income households are those in the bottom quartile of total expenditures, based on the 2014 Consumer Expenditure Survey.
Joint Center for Housing Studies of Harvard University. (2016). The State of the Nation’s Housing 2016. Retrieved from http://www.jchs.harvard.edu/research/state_nations_housing
[45] Horowski, M. (2012). Housing Instability and Health: Findings from the Michigan Recession and Recovery Study. National Poverty Center, Policy Brief No. 29. Retrieved from http://npc.umich.edu/publications/policy_briefs/brief29/
[46] Liu, Y., Njai, R. S., Greenlund, K. J., Chapman, D. P., & Croft, J. B. (2014). Relationships Between Housing and Food Insecurity, Frequent Mental Distress, and Insufficient Sleep Among Adults in 12 US States, 2009. Preventing Chronic Disease, 11. Retrieved from http://www.cdc.gov/pcd/issues/2014/13_0334.htm
[47] For a summary of how “toxic stress” affects children’s development, see:
Coventry, K. (2016). When Every Dollar Counts: Child Poverty Has Lasting Negative Effects, But Even Small Income Boosts Can Help. Washington, DC: DC Fiscal Policy Institute. Retrieved from http://www.dcfpi.org/wp-content/uploads/2016/02/When-Every-Dollar-Counts-Child-Poverty-Income-and-TANF-final.pdf
[48] Kushel, M. B., Gupta, R., Gee, L., & Haas, J. S. (2006). Housing Instability and Food Insecurity as Barriers to Health Care Among Low-Income Americans. Journal of General Internal Medicine, 21(1), 71-77. Retrieved from http://www.ncbi.nlm.nih.gov/pmc/articles/PMC1484604/
Pollack, C. E., Griffin, B. A., & Lynch, J. (2010). Housing Affordability and Health Among Homeowners and Renters. American Journal of Preventive Medicine, 39(6), 515-521. Retrieved from http://www.ncbi.nlm.nih.gov/pubmed/21084071
[49] Here, low-income households are those in the bottom quartile of total expenditures, based on the 2014 Consumer Expenditure Survey.
Joint Center for Housing Studies of Harvard University. (2016). The State of the Nation’s Housing 2016. Retrieved from http://www.jchs.harvard.edu/research/state_nations_housing
[50] Krieger, J,, & Higgins, D. (2002). Housing and Health: Time Again for Public Health Action. American Journal of Public Health, 92(5), 758-768. Retrieved from https://www.ncbi.nlm.nih.gov/pmc/articles/PMC1447157/#r43
[51] The study, commissioned by the US Department of Housing and Urban Development, evaluated the random assignment of housing vouchers to families with children who were receiving, had recently received, or were eligible for Temporary Assistance for Needy Families. The evaluation was conducted in six cities: Atlanta and Augusta, Georgia; Fresno and Los Angeles, California; Houston, Texas; and Spokane, Washington.
Gubits, D., Khadduri, J., & Turnham, J. for Abt Associates.(2009). Housing Patterns of Low Income Families With Children: Further Analysis of Data From the Study of the Effects of Housing Vouchers on Welfare Families. Joint Center for Housing Studies of Harvard University. Retrieved from http://jchs.harvard.edu/research/publications/housing-patterns-low-income-families-children-further-analysis-data-study
Mills, G., Gubits, D., Orr, Larry., Leong, D., Feins, J., Kaul, B. Wood, M. (2006). Effects of Housing Vouchers on Welfare Families. US Department of Housing and Urban Development, Office of Policy Development and Research. Retrieved from https://www.huduser.gov/publications/pdf/hsgvouchers_1_2011.pdf
Wood, M., Turnham, J., & Mills, G. for Abt Associates. (2008). Housing Affordability and Family Well-Being: Results from the Housing Voucher Evaluation. Housing Policy Debate, 19(2), 367-412. Retrieved from http://www.abtassociates.com/reports/Woods_Turnham_Mills_%5B11%5D_HPD.pdf
[52] Riccio, J. A. (2007). Subsidized Housing and Employment: Building Evidence About What Works to Improve Self-Sufficiency. Cambridge, MA: Joint Center for Housing Studies of Harvard University. Retrieved from http://www.jchs.harvard.edu/research/publications/subsidized-housing-and-employment-building-evidence-about-what-works-improve
One study found temporary drops in earnings when families first receive vouchers, perhaps because some adults changed jobs when they moved, but that effect dissipated over time, and vouchers had no effect on work over a 42-month follow up period. For more on the evidence on affordable housing and earnings, see:
Fischer, W. (2015). Research Shows Housing Vouchers Reduce Hardship and Provide Platform for Long-Term Gains Among Children. Washington, DC: Center on Budget and Policy Priorities. Retrieved from http://www.cbpp.org/research/housing/research-shows-housing-vouchers-reduce-hardship-and-provide-platform-for-long-term
Sard, B. (2013). Most Rental Assistance Recipients Work, Are Elderly, or Have Disabilities. Washington, DC: Center on Budget and Policy Priorities. Retrieved from http://www.cbpp.org/research/most-rental-assistance-recipients-work-are-elderly-or-have-disabilities
[53] The study compared within-household, across-siblings variation in adulthood earnings and participation in public housing or housing voucher programs, using confidential longitudinal data from the US Census Bureau and Department of Housing and Urban Development spanning 2000 to 2010. By comparing siblings from the same household who spent different amount of years in subsidized housing, the study is able to control for variation between households and importantly, for variation in selection into subsidized housing. The results were estimated by sex and by type of subsided housing: for each additional year spent in public housing, adulthood earnings increased female earnings by 4.7 percent and male earnings by 2.6 percent, while each additional year spent in voucher housing increased female earnings by 4.9 percent and male earnings by 5.1 percent. In addition, the study found that children who spent longer amounts of time in subsidized housing were less likely to be incarcerated in 2010.
Andersson, F., Haltiwanger, J. C., Kutzbach, M. J., Palloni, G. E., Pollakowski, H. O., & Weinberg, D. H. (2016). Childhood Housing and Adult Earnings: A Between-Siblings Analysis of Housing Vouchers and Public Housing. (NBER Working Paper No. 22721). Cambridge, MA: National Bureau of Economic Research. Retrieved from http://www.nber.org/papers/w22721 http://www.nber.org/papers/w22721
[54] Figures in this paragraph are from DCFPI analysis of the Department of Housing and Community Development’s Development Finance Division pipeline report, available to the public online. The totals include all projects with financing that closed in fiscal years 2010 through 2016 (96 projects), as well as projects that are in underwriting (48 projects), including the selections announced in January 2016 and November 2016. Figures are rounded to the nearest 10 units. Note that the projects that have not yet closed may undergo minor changes during the underwriting process. Project information was cross referenced with following sources to ensure accuracy and fill in incomplete entries: DHCD, DC Housing Authority, and DC Housing Finance Agency documents; press releases; news articles; developer websites; the DC Preservation Catalogue, and project subsidy data from the US Department of Housing and Urban Development. Replacement public housing units constructed as part of HOPE VI or New Communities Initiative projects are counted as preserved, rather than new, extremely low-income units.
DC Department of Housing and Community Development. (2016). Development Finance Division Pipeline Report. Retrieved from https://octo.quickbase.com/db/bit4kvfmq
NeighborhoodInfo DC. (2016). DC Preservation Catalogue. Washington, DC: Urban Institute and Coalition for Nonprofit Housing and Community Development. Retrieved from http://dcpres.urban.org/DCP/
US Department of Housing and Urban Development. (2015). Picture of Subsidized Households. Retrieved from https://www.huduser.gov/portal/datasets/picture/yearlydata.html
[55] Includes new tenant-based vouchers and targeted affordable housing vouchers added to the Local Rent Supplement Program in fiscal years 2010 through 2016. For a breakdown of vouchers added by type and fiscal year, see the DCFPI Budget Toolkits, available at www.dcfpi.org.
For more on the Local Rent Supplement Program, see:
DC Fiscal Policy Institute. (2016). Policy Basics: The Local Rent Supplement Program. Washington, DC. Retrieved from http://www.dcfpi.org/wp-content/uploads/2016/04/16-04-LRSP-Brief.pdf
[56] For more on tenant opportunity to purchase, see:
Reed, J. (2013). DC’s First Right Purchase Program Helps to Preserve Affordable Housing and Is One of DC’s Key Anti-Displacement Tools. Washington, DC: DC Fiscal Policy Institute. Retrieved from http://www.dcfpi.org/wp-content/uploads/2013/09/9-24-13-First_Right_Purchase_Paper-Final.pdf
[57] For more information on the Housing Production Trust Fund, see:
DC Fiscal Policy Institute. (2016). Policy Basics: The Housing Production Trust Fund. Washington, DC. Retrieved from http://www.dcfpi.org/wp-content/uploads/2016/04/16-04-HPTF-Brief.pdf
[58] Analysis of the Department of Housing and Community Development’s Development Finance Division pipeline report. See note 54.
[59] For more information on the Local Rent Supplement Program, see:
DC Fiscal Policy Institute. (2016). Policy Basics: The Local Rent Supplement Program. Washington, DC. Retrieved from http://www.dcfpi.org/wp-content/uploads/2016/04/16-04-LRSP-Brief.pdf
[60] The National Housing Trust Fund may provide operating assistance only to units that also received capital assistance from the NHTF; however, the federal NHTF regulations do not specify any minimum amount of capital assistance. This indicates that a nominal NHTF capital investment may be used to open up the unit to operating assistance eligibility.
Housing Trust Fund, 24 C.F.R. 93 (2016). Retrieved from https://www.gpo.gov/fdsys/pkg/CFR-2016-title24-vol1/pdf/CFR-2016-title24-vol1-part93.pdf
[61] DCFPI analysis of the DC Preservation Catalogue. Projects lost to subsidy expiration are those categorized in the catalogue as “Lost Rental” where the subsidy end date has passed. According to the US Department of Housing and Urban Development, 88 percent of project-based Section 8 units are occupied by extremely low-income households.
NeighborhoodInfo DC. (2016). DC Preservation Catalogue. Washington, DC: Urban Institute and Coalition for Nonprofit Housing and Community Development. Retrieved from http://dcpres.urban.org/DCP/
US Department of Housing and Urban Development. (2015). Picture of Subsidized Households. Retrieved from https://www.huduser.gov/portal/datasets/picture/yearlydata.html
[62] Department of Housing and Community Development. (2016). Housing Preservation Strike Force Final Report. Retrieved from http://dhcd.dc.gov/node/1200052
[63] For more on DC’s public housing, see:
Zippel, C. (2016). DC’s Public Housing: An Important Resource at Risk. Washington, DC: DC Fiscal Policy Institute. Retrieved from http://www.dcfpi.org/dcs-public-housing-an-important-resource-at-risk
[64] A cross-site examination of public housing redevelopments by HUD concluded that among other factors, “it appears that stricter screening criteria contributed to a lower share of returning residents.”
Holin, M., Buron, L., Locke, G., & Cortes, A. for Abt Associates (2003). Interim Assessment of the HOPE VI Program Cross-Site Report. Washington, DC: US Department of Housing and Urban Development. Retrieved from https://www.huduser.gov/Publications/pdf/HOPE_VI_Cross_Site.pdf
[65] Public housing is a rare source of affordable housing that is family-sized, with three or more bedrooms. Such units are difficult to access with a housing voucher in the private market, as they are only a small share of the private-market housing stock, and are often priced too high to be eligible for voucher use.
For more, see:
Zippel, C. (2016). DC’s Public Housing: An Important Resource at Risk. Washington, DC: DC Fiscal Policy Institute. Retrieved from http://www.dcfpi.org/dcs-public-housing-an-important-resource-at-risk
[66] Studies of HOPE VI, a public housing redevelopment program, have found troublingly large shares of residents were no longer living in subsidized housing at all after redevelopment—ranging from 10 to 18 percent, depending on the study. Most families who became unassisted reported having trouble paying the rent, and many moved frequently.
Comey, J. (2007). HOPE VI’d and On the Move. Washington, DC: Urban Institute. Retrieved from http://www.urban.org/sites/default/files/alfresco/publication-pdfs/311485-HOPE-VI-d-and-On-the-Move.PDF
Buron, L., Popkin, S., Levy, D., Harris, L., & Khadduri, J. (2002). The HOPE VI Resident Tracking Study: A Snapshot of the Current Living Situation of Original Residents from Eight Sites. Washington, DC: Urban Institute and Abt Associates. Retrieved from http://www.urban.org/sites/default/files/alfresco/publication-pdfs/410591-The-HOPE-VI-Resident-Tracking-Study.pdf
US Government Accountability Office. (2003). HOPE VI Resident Issues and Changes in Neighborhoods Surrounding Grant Sites. Retrieved from http://www.gao.gov/new.items/d04109.pdf
An evaluation of voucher success rates found that being in a large (5+ member) family reduces the probability of voucher success by 7 percentage points relative to smaller (3-4 member) families.
Finkel, M., & Burton, L. for Abt Associates. (2001). Study on Section 8 Voucher Success Rates, Volume 1: Quantitative Study of Success Rates in Metropolitan Areas. Washington, DC: US Department of Housing and Urban Development. Retrieved from https://www.huduser.gov/publications/pdf/sec8success.pdf
[67] For more on Boston’s permanent affordability policy, see:
Bondi, M. (2016). DC Long Term Affordability Roundtable. Washington, DC: Enterprise Community Partners. Retrieved from http://www.enterprisecommunity.org/blog/2016/09/dc-long-term-affordability-roundtable
Zippel, C. (2016). How to Build Affordable Housing Without an Expiration Date. Washington, DC: DC Fiscal Policy Institute. Retrieved from http://www.dcfpi.org/how-to-build-affordable-housing-without-an-expiration-date