

Income inequality and racial inequity persisted in 2024, according to new data from the Census Bureau’s American Community Survey (ACS), while the rate of poverty rose. For example, Black District residents had just over one-third (36 percent) of the median household income of white residents. The sobering new data show that Mayor Bowser’s trickle-down economic strategy—an extension of her “economic comeback plan”—focusing on business subsidies and bolstering downtown has failed to lead to more widespread prosperity or improvements in the lives of the District’s Black and brown residents.
The already dire conditions for Black and brown residents and those with low incomes are likely to worsen in 2025 and beyond as the combined harm of federal layoffs on DC’s economy and cuts to vital safety net programs like the Supplemental Nutrition Assistance Program (SNAP) and Medicaid take effect. Instead of boosting programs that would help DC’s most vulnerable residents weather this economic storm, the mayor and DC Council recently passed a draconian budget that eliminates DC’s Child Tax Credit (a proven antipoverty tool), slashes the Healthcare Alliance that provides medical care for those ineligible for Medicaid (primarily immigrants with low incomes), and severely underfunds the Emergency Rental Assistance Program, among many other deep cuts to benefits and services that help residents struggling the most make ends meet. The mayor and Council should reverse course and invest more deeply in policies and programs that address racial disparities and reduce poverty.
Zero Progress Made on Racial Income Disparities in 2024
DC median household income remained statistically unchanged in 2024 from the year prior, at over $112,000, adjusted for 2025 dollars. Half of all households in the District have income above the median income and half have income below it.
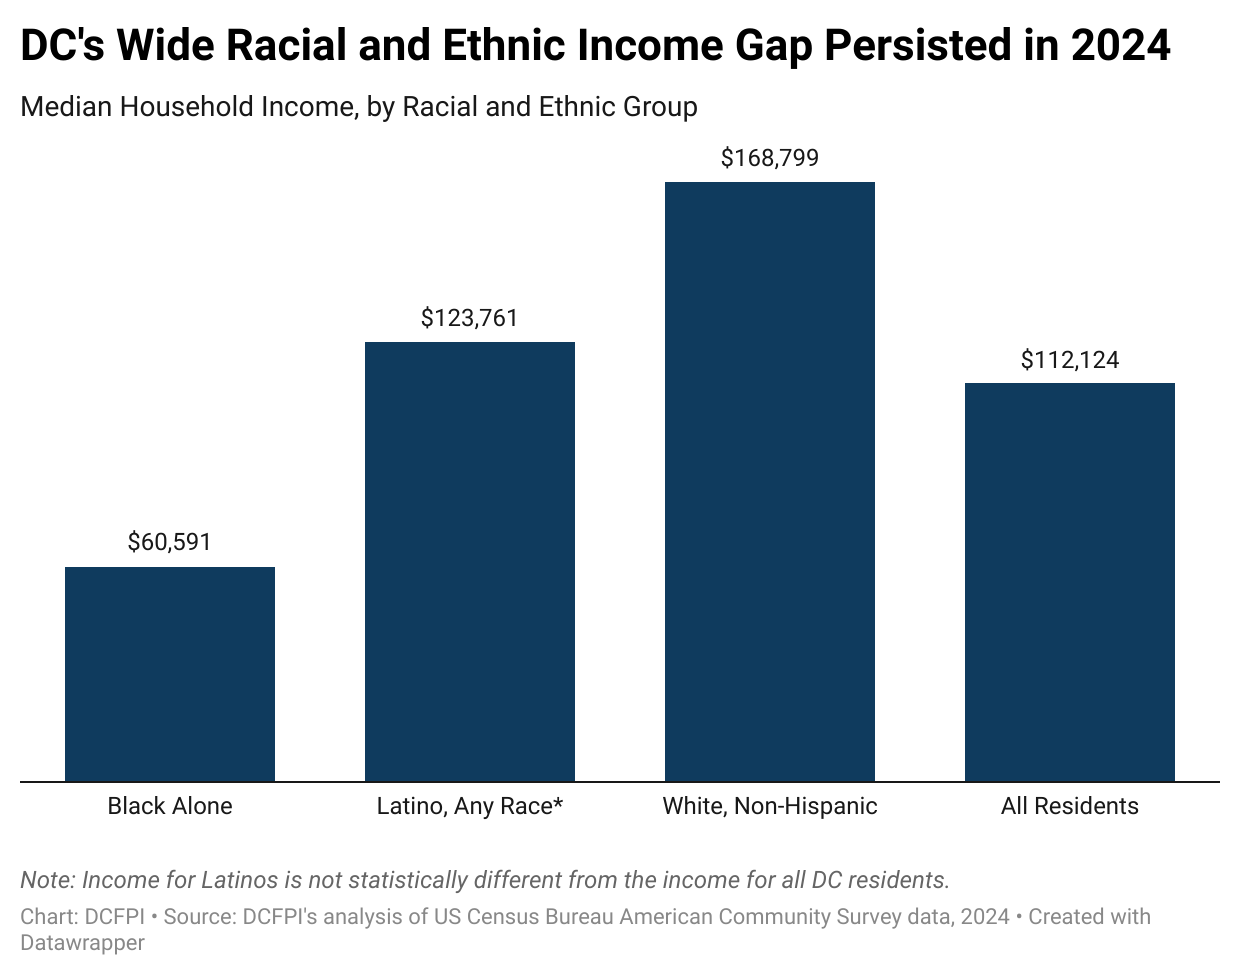
Overall median household income masks deep and persistent racial and ethnic disparities, as shown in Figure 1:
- The median income of $60,591 for Black households (statistically unchanged from 2023) was just over one-third of the $168,800 median household income for white, non-Hispanic households (also statistically unchanged from 2023).
- Median income for Latino households, $123,762, also remained statistically unchanged from 2023; however, a small sample size and high margins of error for estimates for this group may also make this data unreliable.
Extreme Levels of Income Inequality Persist
Income inequality did not budge in 2024. DC households at the top end of the economic ladder captured a majority of the income generated in DC’s economy. Households in the top fifth of the income distribution—which are overwhelmingly white—captured 54.6 percent of all income in 2024, leaving less than half of all DC income for everyone else in DC (Figure 2). Compare that to 1.7 percent of income held by the lowest-paid 20 percent, which are mostly Black and brown households.
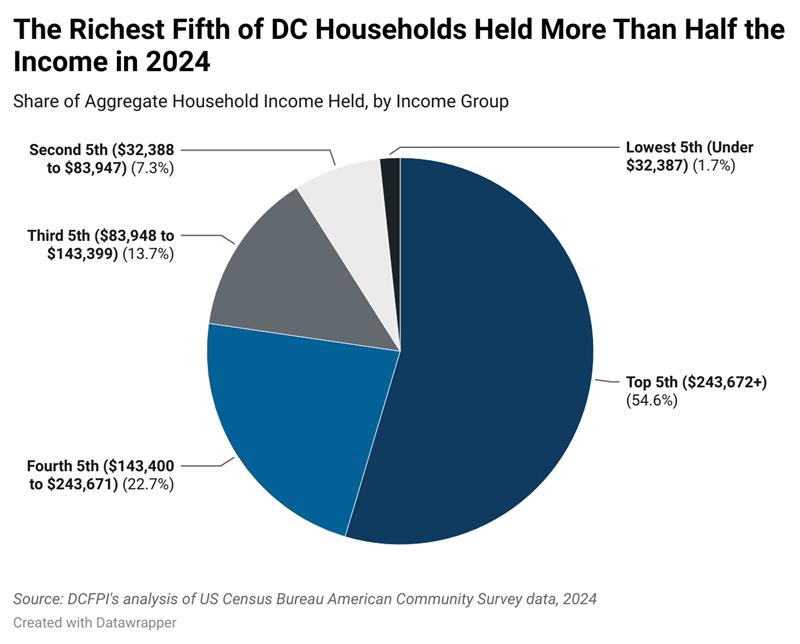
Income is even more concentrated at the very top, with the highest-paid 5 percent capturing nearly 25 of every 100 dollars of income generated in 2024, or more than the income of the bottom 60 percent of households combined (23 of every 100 dollars; analysis not shown). Moreover, under a key Census measure of inequality known as the “Gini coefficient,” DC once again tied with New York for the highest levels of income inequality in the nation except for Puerto Rico. These persistent levels of income inequality threaten DC’s economy and social fabric and undermine the path towards shared abundance, in part because income inequality has been found to slow growth and lengthen the time it takes for economies to recover from downturns or other shocks.
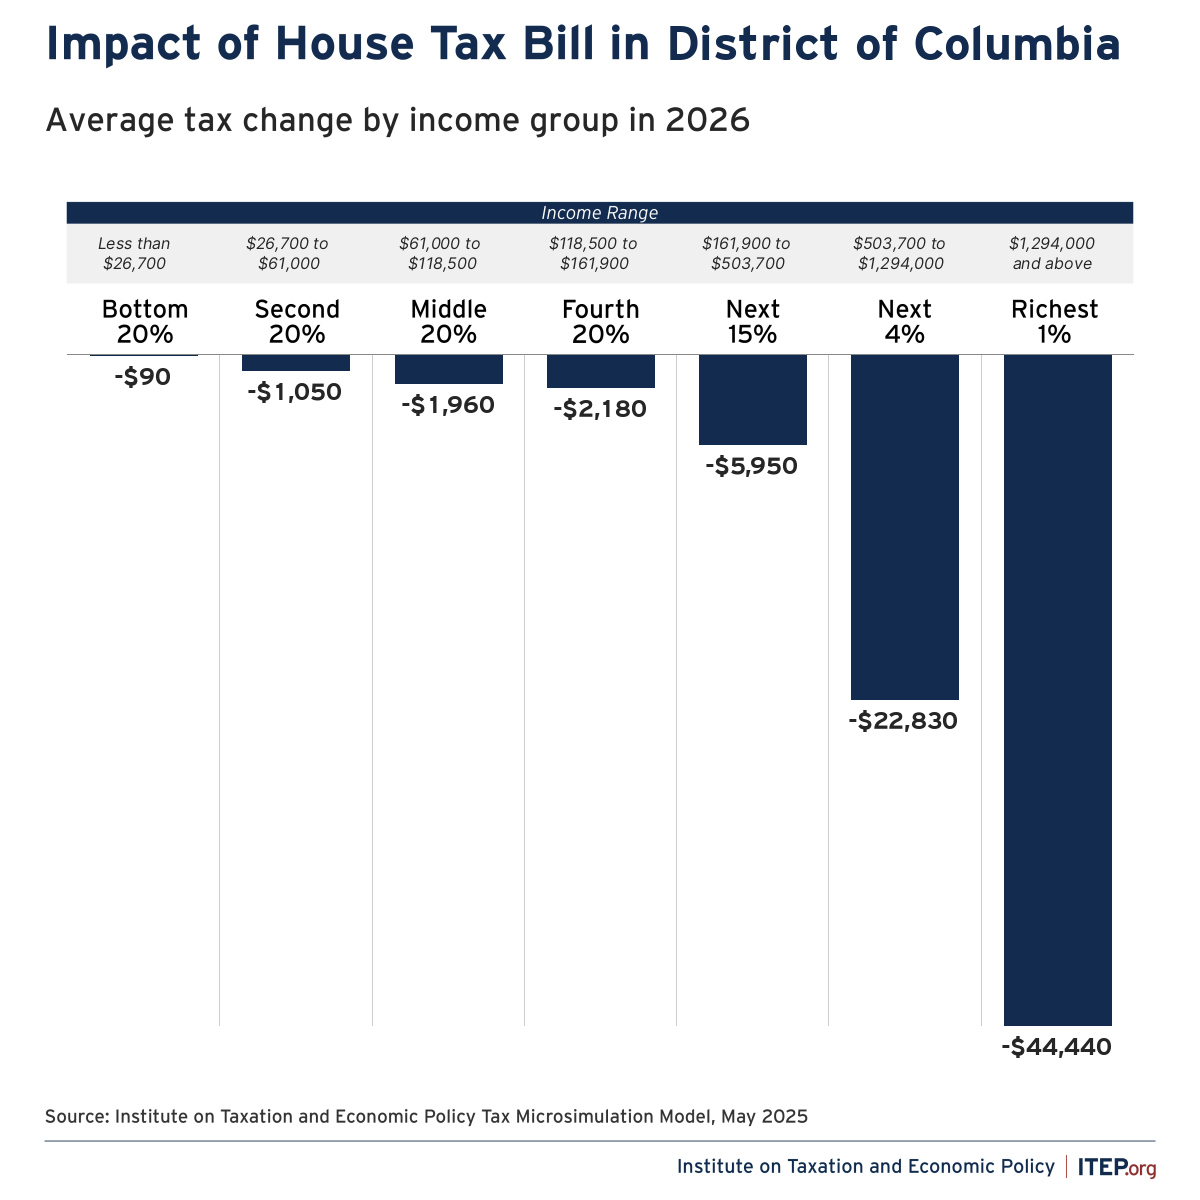
Income inequality will likely only continue to worsen in the coming years as the recently passed federal mega-bill takes effect. In the largest transfer of wealth from the bottom up in US history, the plan gives an average tax cut of nearly $42,000 annually to households with incomes over $1.3 million (the top 1 percent) while giving $90 on average to households with income less that about $27,000 (the bottom 20 percent). In addition, the bill excludes the households of 38,000 District children from receiving an increase to the Child Tax Credit. These federal policy changes, compounded with federal layoffs that are likely to exacerbate the Black-white employment gap in DC, threaten to worsen the District’s ongoing racial economic inequality.
DC Continued Backsliding on Poverty in 2024
More than 116,544 District residents last year—enough people to fill the Nationals Park nearly three times. The overall poverty rate in DC rose significantly in 2024 to 17.3 percent, or 3.3 percentage points higher than the previous year (For an explanation of the official poverty measure, see ‘Increase in DC’s Supplemental Poverty Measure Rate Compared to Official Poverty Measure Rate Likely Due to Threshold Changes’ below.) The new data highlights deep and longstanding racial inequities: the increased poverty rate in 2024 reflects lawmakers’ inability to reduce poverty among Black residents. Due to systemic racism, historical and ongoing discrimination, and barriers to opportunity, 1 in 4 Black residents in DC are experiencing poverty. Based on the official poverty measure, in 2024:
- The poverty rate among Black residents remained statistically unchanged from 2023 at 30.5 percent. Black poverty was 13.2 percentage points higher than the overall rate.
- The poverty rate among non-Hispanic white residents was statistically unchanged from 2023 at a low 4.6 percent.
- The poverty rate among Latino residents grew to 11.9 percent in 2024. This is a 6.7 percentage point increase compared to 2023 after a similarly stark drop in the rate from 2022. However, small sample size and high margins of error make the estimates for both years and the magnitude of the change unreliable.
The District’s stark racial disparities in the poverty rate are chronic. Over the last decade (2014 to 2024), the Black poverty rate never dipped below 21.3 percent and in 2024 reached a decade high of 30.5 percent. In other words, at least 1 in 5 and sometimes nearly 1 in 3 Black residents lived in poverty in any given year over the last decade, underscoring persistent economic hardship and disadvantage. That stands in contrast to the experience of white residents, whose poverty rate never reached higher than nearly 8 percent (or about 1 in 13) in the same period and shrunk to its lowest level of 4.2 percent in 2023. Being born and raised in persistent poverty (as opposed to short stints of poverty) damages children’s long-term outcomes, and there is even greater harm when those children grow up in high-poverty neighborhoods where the cumulative harm of hardship is magnified, particularly for Black communities.
Despite the persistently high poverty rate in the District, especially for Black residents, Mayor Bowser and the DC Council recently passed a fiscal year 2026 budget that cuts programs that help residents with low incomes make ends meet, such as the Healthcare Alliance and DC’s Child Tax Credit. Those cuts are on top of the Trump administration’s mega-bill, which will remove thousands of District residents from SNAP and Medicaid. Together, these policies threaten to worsen poverty over the next few years. This year’s Census report, combined with the further hits to DC’s economy in 2025, underscores the need for the mayor and the DC Council to invest more deeply in policies and programs that reduce poverty and address racial disparities.
In the Supplemental Poverty Measure, DC’s Rate Increase Likely Due to Threshold Changes
Experts generally agree that the official poverty measure (OPM) used by ACS to determine the poverty rate is inadequate. The OPM compares pre-tax cash income, including income from earnings, unemployment insurance, and cash-based public assistance, against a threshold that is set at three times the cost of a minimum food diet in 1963 and adjusted for family size. The OPM does not take into account other vital supports that individuals and families in the District may receive, such as the Child Tax Credit or SNAP benefits, nor does it account for the substantial variation in cost of living by geography.
The Census also provides a Supplemental Poverty Measure (SPM), which includes tax credits and non-cash benefits like SNAP in calculating income and sets a threshold based on a fuller range of living expenses, including housing, in a given calendar year. Three-year state-level data for 2022 to 2024 shows that the SPM rate was 2.9 percentage points higher than the OPM rate over the same period. The SPM also suggests that DC made no progress on overall poverty reduction when compared with the previous 2021 to 2023 three-year period.
The comparatively higher SPM rate was driven by a myriad of complicating factors as outlined by experts, making year by year comparisons difficult. Expiration of SNAP COVID-19 emergency allotments in 2023 pushed more individuals below the SPM poverty line. In addition, SPM poverty thresholds rose five percent in 2024, largely because of a four percent increase in prices in 2024 for the items that compose the SPM threshold. The SPM threshold fluctuates each year to reflect what typical households spend on basic needs, such as food and housing, averaged over five years. Therefore, the difference between the OPM and SPM rates for DC should be looked at with caution. However, as is clear from both sets of data, poverty rose in DC in 2024 and is likely to continue rising over the next few years.