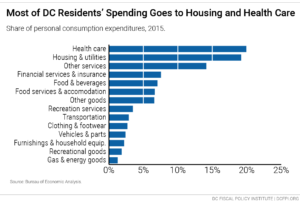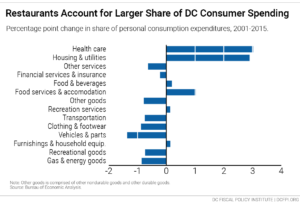
District residents spent $37 billion in 2015. Where did that money go? A look at data on personal consumption expenditures tells us a lot about the changing composition of the DC economy. In particular, DC residents are devoting a larger share of their spending to housing, health care, and restaurants, and a smaller share to cars, clothes, and recreational goods (Figure 1).[i]

While the reasons behind an increase in spending on any given category is not always clear-cut (changes in price and quantity each make a difference), the growth in housing and restaurant expenditures can likely be explained by a number of clear trends.
- Housing took up 19 percent of consumer spending in 2015. That’s about $2,100 per month per household.[ii] Housing and utilities grew faster as a share of DC residents’ spending than any other spending category between 2001 and 2015. That is likely related to the fact that as the price of housing increases, low- and moderate-income DC residents whose incomes have stagnated are forced to spend more for the same housing, and less on other goods and services. At the same time, high-income newcomers are choosing to “spend more to get more,” preferring high-end homes with amenities.
- Restaurants: DC residents spent $4.7 billion at restaurants in 2015—that’s $306 per resident per month.[iii] District residents are spending more to eat at restaurants, indicating more well-off residents with large disposable incomes, DC’s strong food service industry, and shifting consumer preferences. Spending at restaurants accounted for 6.7 percent of consumer spending in 2015, up a percentage point from 2001 (Figure 2). By contrast, the share of spending dedicated to groceries didn’t change much.

These trends in consumer spending appear to confirm that DC’s new prosperity and wealth have catalyzed growth, especially in industries that rely on consumers with disposable income, yet at the same time have placed substantial pressure on the housing market.
Research and lived experiences show that low-income DC residents bear the brunt of the burden of rising housing costs, but not necessarily from the booming restaurant scene—a reminder of the importance of policies that promote a more inclusive economy.
[i] All data and figures in this post are from the Bureau of Economic Analysis’s Personal Expenditures (PCE) by State, available at https://www.bea.gov/iTable/index_regional.cfm
[ii] Expenditures on housing and utilities as defined by the Bureau of Economic Analysis: “Housing consists of the monetary rents paid by tenants for tenant-occupied housing, an imputed rental value for owner-occupied dwellings (measured as the income the homeowner could have received if the house had been rented to a tenant), the rental value of farm dwellings, and spending on group housing. Household utilities consist of water supply and sanitation and electricity and gas.” See https://www.bea.gov/regional/definitions/
[iii] The Bureau of Economic Analysis makes adjustments to account for non-resident spending, especially in expenditure categories related to travel and tourism. The BEA notes that these adjustments could be improved through methodological improvements in the future. See Awuku-Budu et al. (2016), available at https://www.bea.gov/scb/pdf/2016/11%20November/1116_personal_consumption_expenditures_by_state.pdf
