The dramatic increase in unemployment in the District during the current economic recession is likely to have led to a growing number of DC residents living in poverty. While official Census Bureau income data for 2009 will not be out until later this year, other measures that are closely tied to poverty ‘ such as the number of food stamp recipients and measures of employment ‘ can be used to estimate how much poverty has grown in 2009. This modeling suggests that an additional 11,000 DC residents fell into poverty last year. Further:
- The poverty rate in the District is estimated to have increased from 16.9 percent in 2008 to 18.9 percent in 2009 (see figure 1). This means an estimated additional 11,000 residents fell into poverty in 2009, bringing the number of poor DC residents to 106,500. (The poverty line in 2009 was $21,800 for a family of four.)
- The projected growth in DC’s poverty rate in 2009 is the largest year-to-year increase since 1995.
- It is likely that poverty is even higher today. DC’s unemployment rate and food stamp caseloads increased rapidly in the last half of 2009. By the end of the year, both indicators were far higher than the 2009 averages used in this analysis.

In Prior Recessions, Increases in Unemployment and Food Stamp Caseloads Were Tied to Increases in Poverty
Rising unemployment, not surprisingly, is tied to increases in poverty. During a recession, the number of families and individuals living in poverty grows as a result of job losses, difficulty in finding new employment, and reductions in work hours and/or wages.
A change in food stamp caseloads is also a strong predictor of an increase in the poverty rate.[1] This is because the food stamp program is one of the broadest safety net programs in the nation, and it is open to individuals and families with incomes close to the poverty level ‘ below 130 percent of poverty.[2]
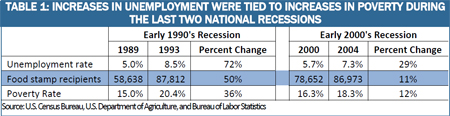
During the last two national recessions ‘ in the early 1990’s and in the early 2000’s ‘ increases in unemployment led to both higher food stamp caseloads and higher poverty in the District.
- During the early 1990’s recession, DC’s unemployment rate rose 72 percent ‘ from 5 percent in 1989 to 8.5 percent in 1993. At the same time, the number of food stamp recipients grew nearly 50 percent. As a result of the dramatic rise in unemployment, the poverty rate increased from 15 percent in 1989 to 20 percent in 1993 ‘ as an additional 25,000 DC residents were living in poverty in 1993.
- The recession of the early 2000’s was not as severe as the recession of the early 1990’s, yet both unemployment and poverty rose. The District’s unemployment rate increased by nearly a third, from 5.7 percent in 2000 to 7.3 percent in 2004. Food stamp caseloads also increased during this time, from 79,000 recipients in 2000 to 87,000 recipients in 2004. The rising unemployment pushed DC’s poverty rate from 16.3 percent in 2000 to 18.3 percent in 2004.

Economic Indicators Point to an Increase in Poverty in the District in 2009
Poverty data for 2009 from the Census Bureau will not be available until August 2010. However, the other currently available measures that are strongly related to poverty status ‘ changes in employment and food stamp caseloads’ can be used to estimate how much poverty grew in 2009.[3]
- DC’s unemployment rate has more than doubled during the recession, rising from 5.6 percent in January 2008 to 11.9 percent in December 2009 (see figure 2). Average annual unemployment in DC rose by more than half ‘ from 6.6 percent in 2008 to 10.2 percent in 2009.

- Food stamp caseloads also have seen a significant increase. The number of DC residents receiving food stamps increased from 89,300 in the start of 2008 to 114,400 by December 2009 (see figure 3). The average food stamp caseload in 2009 was 16 percent higher than the average for 2008.

The changes in employment and food stamp caseloads in the District can be used to estimate how much poverty rose in 2009.
- This analysis projects that DC’s poverty rate rose from 16.9 percent in 2008 to 18.9 percent in 2009.[4] This means that an estimated 11,000 more DC residents fell into poverty last year, bringing the total number of DC residents living below the poverty line to 106,500.
- The increase in the poverty rate for 2009 is the highest year-to-year change in the poverty rate in the District since 1995 (see figure 4).[5]

Table 2 displays the rise in the unemployment rate, food stamp caseloads and, ultimately, the poverty rate in the District during the current economic recession.

Poverty Is Likely to Be Even Higher in the District in 2010
Unemployment and food stamp caseloads rose throughout 2009 and were much higher at the end of the year than at the start. The most recent figures are much higher than the averages used in this analysis to estimate the poverty rate for 2009. As result, it is likely that poverty in the District is now higher than the 18.9 percent projection for 2009.
For example, the unemployment rate at the end of 2009 was 11.9 percent. This is much higher than the 2009 average unemployment rate, which was 10.2 percent. The food stamp caseload in December 2009 was 114,000, higher than the 2009 average of 107,000.
Moreover, both poverty and unemployment have been shown to take longer to recover after a recession is officially over, and national data indicate that poverty is the slowest to recover after a recession ends.[6] With DC’s unemployment rate currently at a record level at the start of 2010 ‘ 12 percent’ it is likely that poverty is on the rise in 2010 and that a decline in poverty may be years away.
[1] Parrot, Sharon, “Recession Could Cause Large Increases in Poverty and Push Millions Into Deep Poverty,” Center on Budget and Policy Priorities, November 2008, available at: http://www.cbpp.org/cms/index.cfm?fa=view&id=1290
[2] On March 15, 2010 the District adopted the Categorical Eligibility program which increased the income threshold for food stamps from 130 percent of poverty to 200 percent of poverty. In addition, asset tests for food stamps were removed. This will result in more DC residents becoming eligible for food stamps.
[3] The employment measure used in our poverty model is the percent of District residents that are employed compared to the total civilian non-institutional population 16 and older in the District. This is considered a better measure to predict poverty levels than the unemployment rate. Unlike the unemployment figure, which can exclude people who have stopped looking for a job, the changes in the ratio of the population that is employed over time can give an indication of how many persons are losing their jobs ‘ and their incomes.
[4] In order to estimate the poverty rate in DC for 2009, DCFPI utilized a regression analysis that measures the relationship between food stamp caseloads, employment changes, and poverty, and then uses changes in food stamp caseloads and employment in 2009 to predict DC’s 2009 poverty rate. The regression analysis was conducted by the Center on Budget and Policy Priorities based on a regression model developed by retired OMB analyst Richard Bavier to predict poverty at the national level.
[5] The poverty data used in this paper comes from the Census Bureau’s Model-Based Small Area Income & Poverty Estimates (SAIPE) for School Districts, Counties, and States. These data are considered the most reliable measures of poverty for states by the Census. SAIPE data is currently available for 1989, 1993, and from 1995-2008. More information on the Census’ SAIPE data can be found here: http://www.census.gov//did/www/saipe/
[6] Center on Budget and Policy Priorities analysis of U.S Census Bureau and Bureau of Labor Statistics data.